Can't Knock The Hustle: NTES Analysis

Published 07/06/2015, 03:26 AM
Updated 07/09/2023, 06:31 AM

Let's take a look at NASDAQ:NTES (NetEase Inc), and analyze its price action via the monthly and weekly charts:
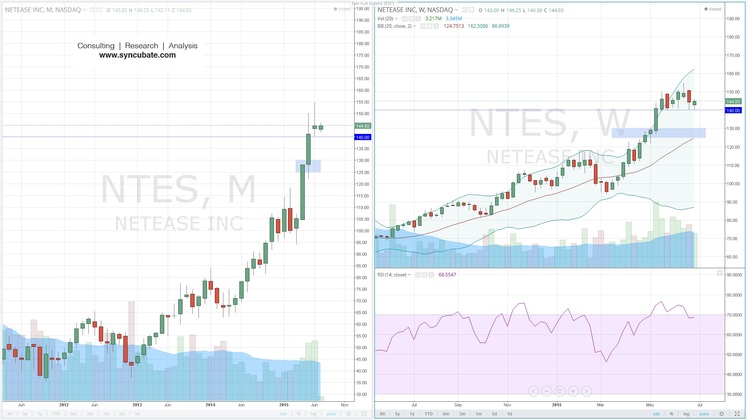
NTES Charts

NTES closed above $140 on the weekly time frame in early May, and has since been bound in a trading range between $140 and $150. In the past sixteen weeks, NTES has closed green thirteen times and has only had three weeks in which the bears dominated over the bulls and closed the stock below its opening price.

The monthly chart shows a rising trend since the beginning of the year, as NTES has now advanced well above the $100 - $110 range it struggled with breaking out of at the time.

The RSI signal is beginning to decline on the weekly chart, and this could be reflective of some approaching price action weakness in the intermediate term. A close below the $140 support level on the weekly would likely portend a further decline towards the congestion zone highlighted on the chart between $125 - $130.

If the bulls can close NTES above $150 on the weekly chart and follow through with strength in the subsequent week's price action, then they may have a chance to further advance the stock. At this point though, I would imagine that a pullback is more likely in order to digest the significant gains that have been made over the past four months.

Latest comments

Loading next article…
Risk Disclosure: Trading in financial instruments and/or cryptocurrencies involves high risks including the risk of losing some, or all, of your investment amount, and may not be suitable for all investors. Prices of cryptocurrencies are extremely volatile and may be affected by external factors such as financial, regulatory or political events. Trading on margin increases the financial risks.
Before deciding to trade in financial instrument or cryptocurrencies you should be fully informed of the risks and costs associated with trading the financial markets, carefully consider your investment objectives, level of experience, and risk appetite, and seek professional advice where needed.
Fusion Media would like to remind you that the data contained in this website is not necessarily real-time nor accurate. The data and prices on the website are not necessarily provided by any market or exchange, but may be provided by market makers, and so prices may not be accurate and may differ from the actual price at any given market, meaning prices are indicative and not appropriate for trading purposes. Fusion Media and any provider of the data contained in this website will not accept liability for any loss or damage as a result of your trading, or your reliance on the information contained within this website.
It is prohibited to use, store, reproduce, display, modify, transmit or distribute the data contained in this website without the explicit prior written permission of Fusion Media and/or the data provider. All intellectual property rights are reserved by the providers and/or the exchange providing the data contained in this website.
Fusion Media may be compensated by the advertisers that appear on the website, based on your interaction with the advertisements or advertisers.
© 2007-2025 - Fusion Media Limited. All Rights Reserved.