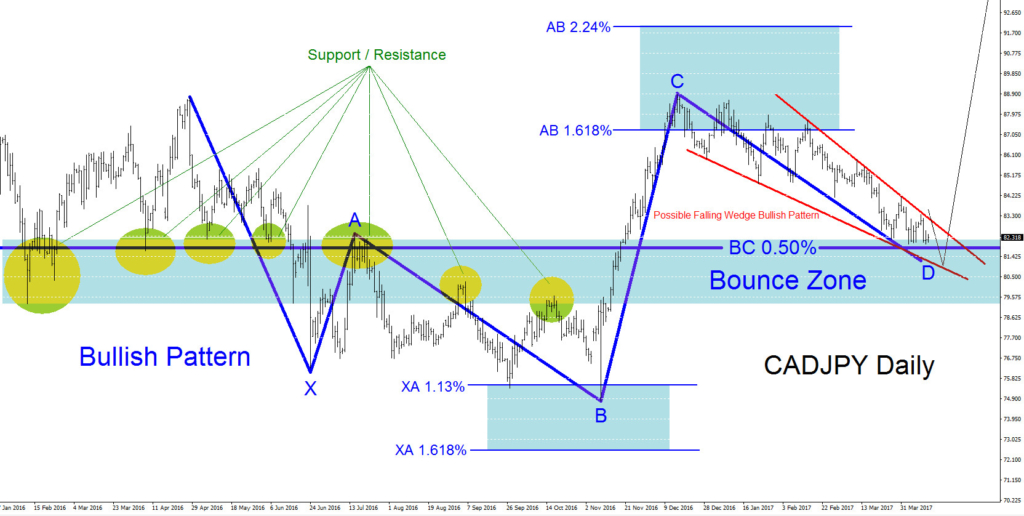
CAD/JPY has been moving lower since December 2016. Price is entering an area where the pair can possibly bounce and reverse higher. There are a couple bullish patterns that seem to be forming and traders need to wait and see if CAD/JPY will find a bottom and terminate the bearish cycle that it is currently in.
Daily Chart Bullish Patterns : On the CAD/JPY Daily chart two visible bullish patterns can be seen (Blue, Red). The blue bullish pattern triggers a BUY at the point D BC 0.50% Fib. retracement level. Price has still yet to touch this level and will need another move lower to trigger. The red falling wedge bullish pattern has still yet to break above the top of the wedge/diagonal. A break above the red pattern wedge can signal that CAD/JPY has possibly bottomed and is ready to start a new cycle higher. 
If looking to buy CAD/JPY traders should be patient and wait for price to make a move lower to the possible bounce zone (light blue box) and towards the BC 0.50% Fib. retracement level at 81.84. Waiting for price to hit the BC 0.50% Fib. retracement will offer a better risk/reward trade setup. Another scenario is traders can wait for price to break above the red wedge pattern. At this current moment above 84.18 confirms the breakout higher. Blue bullish pattern is invalidated if price moves below point B of the pattern.
