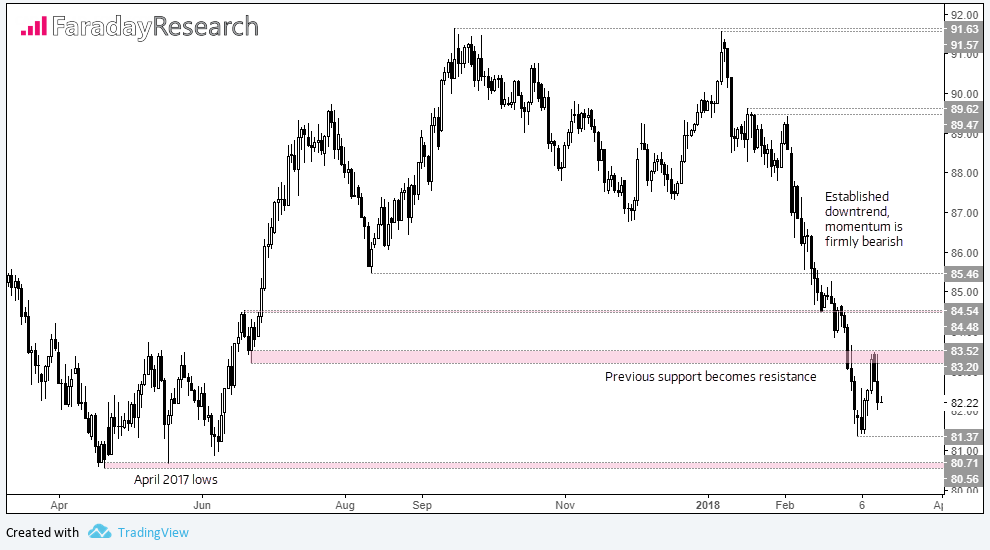
With the rate at which Canadian Dollars have been thrown overboard recently, you’d be forgiven for thinking they were on fire. The threat of a NAFTA fallout and Trump’s latest round of tariffs have been more than enough to keep the Loonie under pressure, despite Canada having been given a ‘temporary’ exemption from the steel and aluminum tariffs. As for JPY, the annual repatriation of the Yen and bouts of risk-off have helped it remain the strongest major this year. Place these two contrasting themes together and what you’re left with is the CAD/JPY chart.

When we last covered CAD/JPY, we noted that bears didn’t appear content with an 8-month low. It turns out they weren’t. And having since broken beneath the original 83.20 target, we now have the April 2017 lows in site around 80.56-80.71.
The daily trend structure remains predominantly bearish and, despite the 2.6% rebound from the 81.37 low, the retracement is relatively shallow in comparison with overall bearish momentum. Interestingly we’ve seen a two-day reversal pattern (dark cloud cover) potentially mark the end of the said 2.6% ‘rebound’, which rejected the 83.20-83.25 to make it a viable area of resistance.

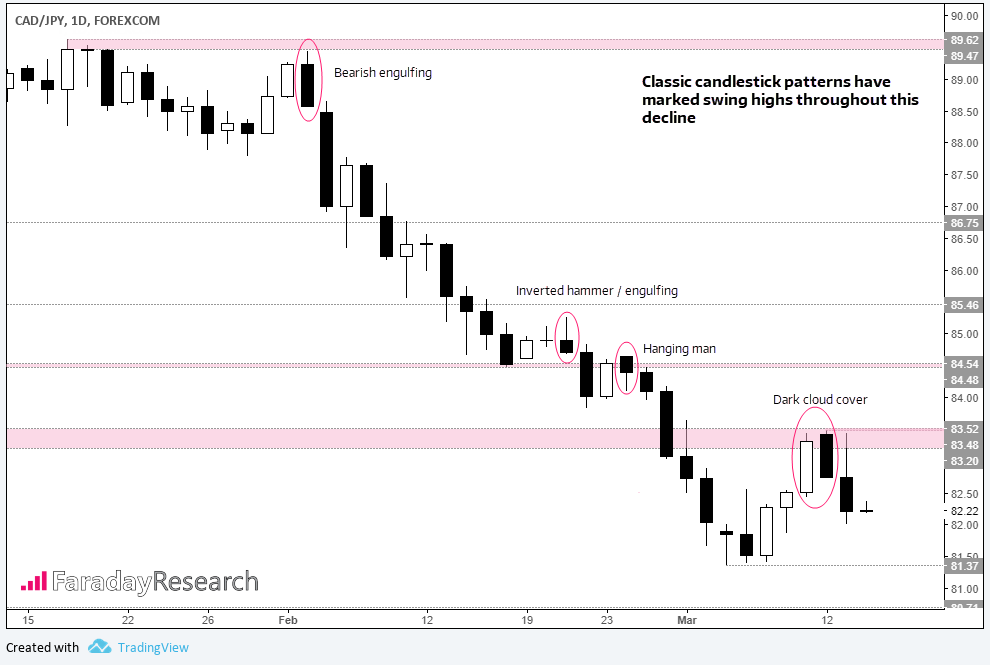
Zooming into the daily chart, we can see that classic candlestick patterns have marked swing highs during this move lower. Whilst this is not always the case at turning points it does appear to be a feature with this trend. Moreover, on three occasions a swing high has occurred near pivotal zones of S/R.
A bearish engulfing candle failed to test the 89.47-89.62 high before hurtling towards 9-month low. On the 26th Feb a hanging man reversal candle marked the top of a 3.9% decline to 81.37. Admittedly it didn’t perfectly respect the 84.48-84.54 area, but that it overlaps suggests traders were aware of this zone. And on Monday we saw a dark cloud cover reversal fall within the 83.20-83.52 lows before losses resumed yesterday.
With a potential swing high having been marked out with Monday’s dark cloud cover, we’re keen to re-join this bearish trend.
From the perspective of a swing trader the setup likely looks appealing for a short. However, as our approach is trade separate phases of the volatility cycle, we now need to see evidence of compression after range expansion. Yesterday’s high-low range was the widest since the 5th February in percentage terms, so jumping into the trade now leaves us at risk of joining a little too late to the party. Waiting for compression leaves us two potential scenarios to enter.
If compression appears on the daily chart in form of a narrow-range bar or inside day, we could consider entering short with a view to target the 81.37 low (and hopefully beyond). Alternatively, if prices continue falling and then break the 81.37 low, we could seek an entry if prices then consolidate beneath this key level on a lower timeframe.
That said, compression may not appear just yet and it is not set in stone the next directional move must be bearish. If we are to see a reversal of US policy regarding trade, that could prove to be a huge relief for export nations and send currencies like CAD sharply higher. This in turn could also allow sentiment to improve and lower the demand for Yen, making CAD/JPY vulnerable to a bearish shakeout. But until such a scenario, we’ll stick with the trend and seek bearish opportunities.
