CAD/JPY: From H&S To iH&S

Published 04/02/2018, 09:54 AM
CAD/JPY
-

Volatility and liquidity on the market are much lower today due to the Easter. Markets are still opened but many traders are not working today. In this case, for the bigger attractions we will have to wait a bit but it does not mean that we do not have anything interesting for You today. Our team spotted a very interesting occasion on the CAD/JPY.


For the past few months, this pair is nicely moving from the H&S to the iH&S. The first one, you can see on the far left of the chart. It was drawn between August and November 2016. The second one is a bit bigger and more technical but it is also expired (created from July 2017 to February 2018). It seems that the whole bearish movement has been already done. The third one is the smallest but is very promising as it is happening on a long-term horizontal support (green). The neckline (red) had been broken in the last week, so the buy signal is up and running.


Currently, we do have a small short-term flag, which is promoting a further rise. With this kind of a price action, we do have quite big chances for a nice upswing here. The sentiment stays positive, as long as the price stays above the green line.

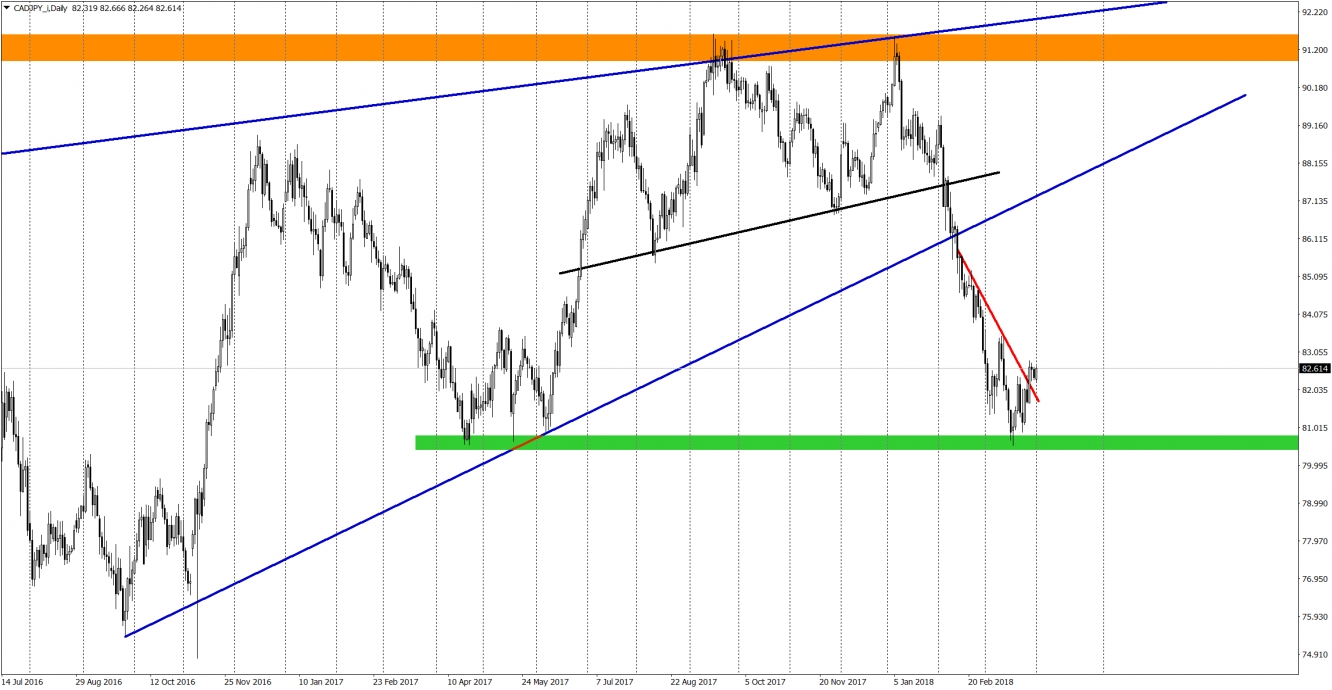
CAD/JPY Daily Chart

Latest comments

Loading next article…
Risk Disclosure: Trading in financial instruments and/or cryptocurrencies involves high risks including the risk of losing some, or all, of your investment amount, and may not be suitable for all investors. Prices of cryptocurrencies are extremely volatile and may be affected by external factors such as financial, regulatory or political events. Trading on margin increases the financial risks.
Before deciding to trade in financial instrument or cryptocurrencies you should be fully informed of the risks and costs associated with trading the financial markets, carefully consider your investment objectives, level of experience, and risk appetite, and seek professional advice where needed.
Fusion Media would like to remind you that the data contained in this website is not necessarily real-time nor accurate. The data and prices on the website are not necessarily provided by any market or exchange, but may be provided by market makers, and so prices may not be accurate and may differ from the actual price at any given market, meaning prices are indicative and not appropriate for trading purposes. Fusion Media and any provider of the data contained in this website will not accept liability for any loss or damage as a result of your trading, or your reliance on the information contained within this website.
It is prohibited to use, store, reproduce, display, modify, transmit or distribute the data contained in this website without the explicit prior written permission of Fusion Media and/or the data provider. All intellectual property rights are reserved by the providers and/or the exchange providing the data contained in this website.
Fusion Media may be compensated by the advertisers that appear on the website, based on your interaction with the advertisements or advertisers.
© 2007-2025 - Fusion Media Limited. All Rights Reserved.