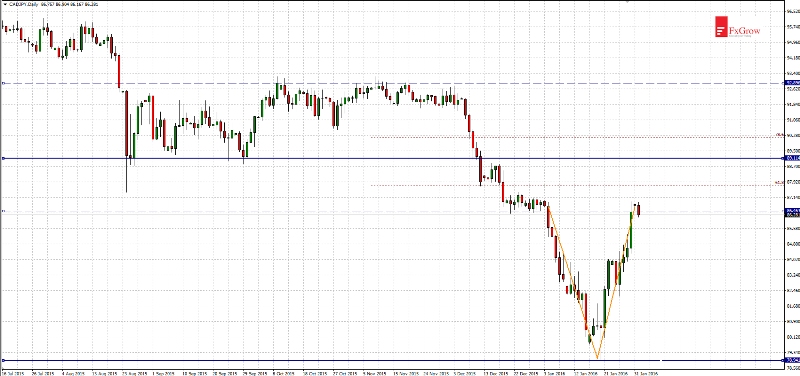
CAD/JPY - V bottom pattern
Since the beginning of January CAD/JPY declined until January 20 when PIN BAR candle with a very long shadow occurred just above support at 78.90 (support from 2012). It was a first signal that rebound may occur. It happened thanks to information from BoJ about further easing action. Due to this rebound we saw a dynamic upward movement and in the chart you can see rare V bottom pattern.
Despite of latest upward move it has to be noted that in a long term price moved in a downtrend and current upward movement didn't reach even Fibonacci 61,8% of previous almost 2-months falls. Currently it is likely that CAD/JPY will test area 89.10 and at that level some kind of correction should occur. Long term sentiment may change for an uptrend one when price will move back and stay above 89.10 level and next resistance at 92.90 will be break above.
Time-frame D1:
Note: This analysis is intended to provide general information and does not constitute the provision of INVESTMENT ADVICE. Investors should, before acting on this information, consider the appropriateness of this information having regard to their personal objectives, financial situation or needs. We recommend investors obtain investment advice specific to their situation before making any financial investment decision.
