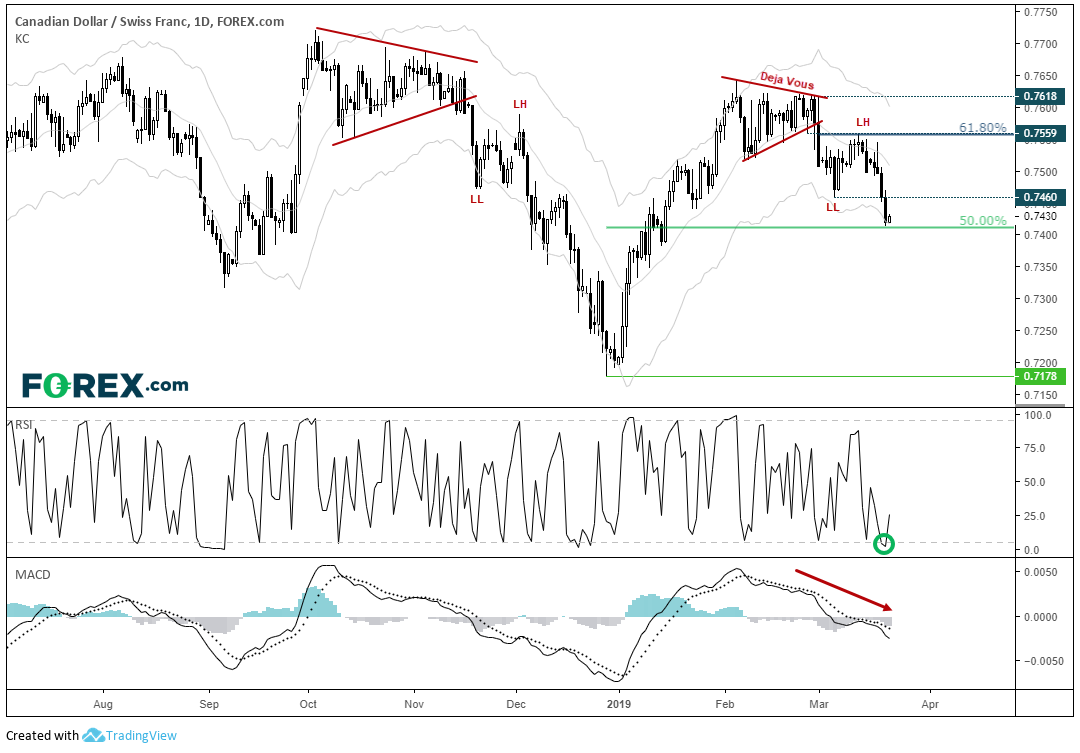
Last Friday we highlighted CAD/CHF’s potential bearish Deja Vous pattern. Whilst bearish momentum is taking hold, we may see a pause in trend before it breaks to new lows.
The daily trend structure is firmly bearish, and the 61.8% Fibonacci retracement level performed well as resistance. Friday’s break out of its 36-pip range marked the beginning of its next impulsive move lower. And two clear, bearish range expansion candles reaffirmed dominance with daily closes beneath 0.7460. Furthermore, the MACD points lower and, with no signs of bearish divergence, the path of least resistance appears to point lower.

If the ‘Deja Vous’ pattern is to be repeated, this could be part of a 400-pip decline and prices could be gearing up for a break beneath the 0.7178 low. However, whilst the bias remains bearish overall, there are a few indications we could be approaching a consolidation phase over the near-term.
- 6 consecutive bearish days: Recent history shows the streak ends around 4-days, and we’ve not seen a streak this long since June 2018.
- Daily close beneath lower Keltner band: As prices typically spend around 98% of their time within the bands, it suggests over-extension over the near-term.
- 2-period RSI oversold: Useful for near-term overbought/oversold, it reached 1.7 by the close
- Stalled at 50% retracement level: Technically not a Fibonacci ratio, but generally a reliable one none-the less.
We don’t consider these warning signals as detrimental to the trend (as that remains bearish beneath the 0.7560 high). But they could provide opportunity for a better-time entry, or to aid trade management by reducing risk exposure if already in a trade.
