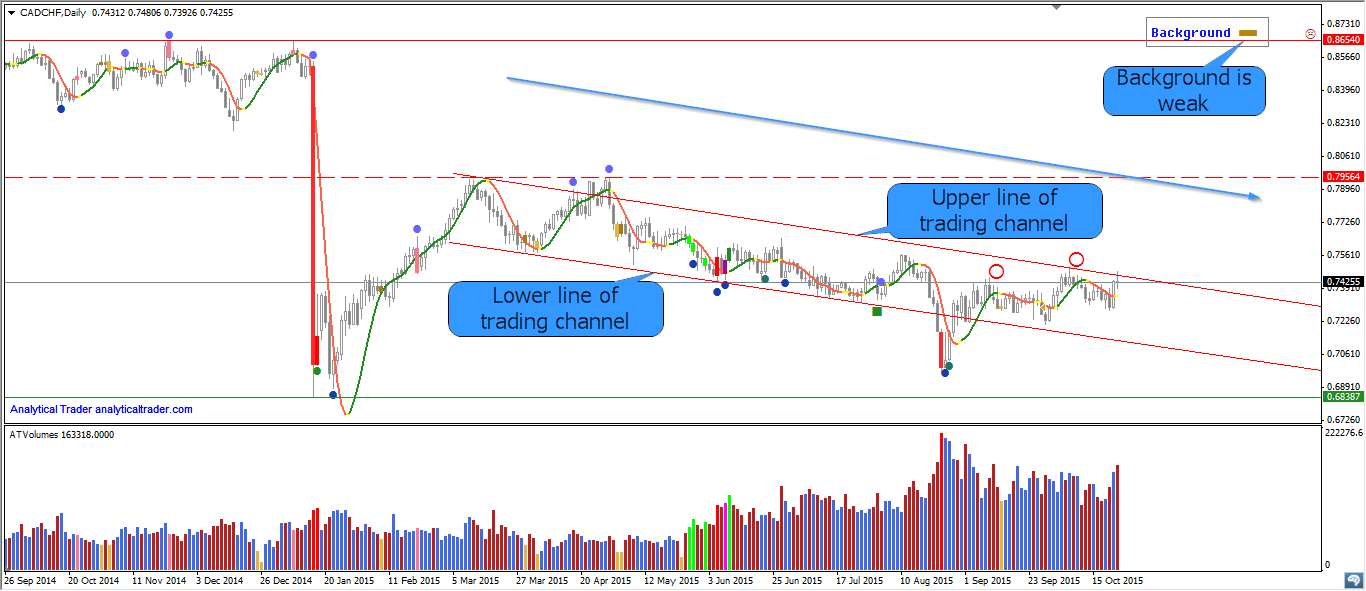
In daily chart CAD/CHF is moving in a bearish trading channel. Background is weak. Lower and upper lines of trading channel are trendlines with several touches. Upper line is a resistance to higher prices and Lower line is a support. The area between the upper and lower trend lines is known as the trading range. In VSA terms, the (sideways) market is trading within its range, and will continue to do so until applied (selling or buying) effort makes it break out. VSA trader will analyze price action in the top and bottom quarters of the trading range, because important observations take place in these areas, as the price heads for the supply or support lines. The area above the supply (higher) trend line is known as overbought and the area below the support (lower) trend line is referred to as oversold.

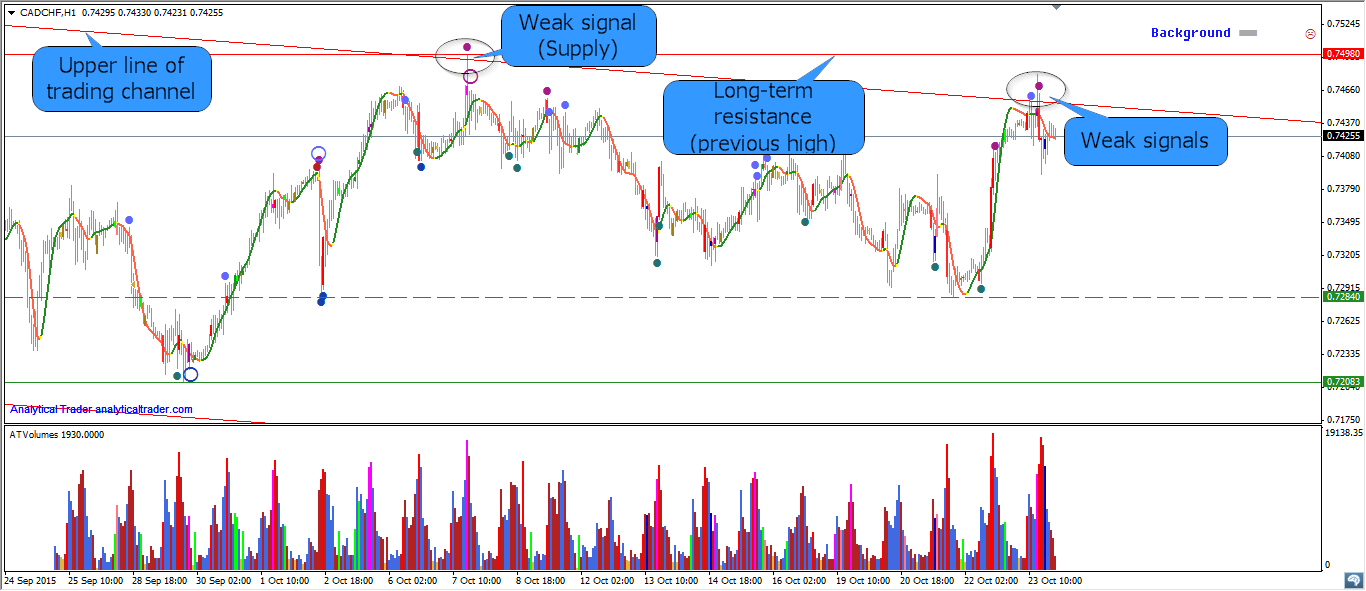
In H1 timeframe the price has reached the upper line of trading channel. Near this area we see several weak signals (Supply and Minor Supply).
