CAD/JPY Long Term Trend Line Declines

Published 12/10/2011, 08:37 AM
Updated 05/18/2020, 08:00 AM
CAD/JPY
-
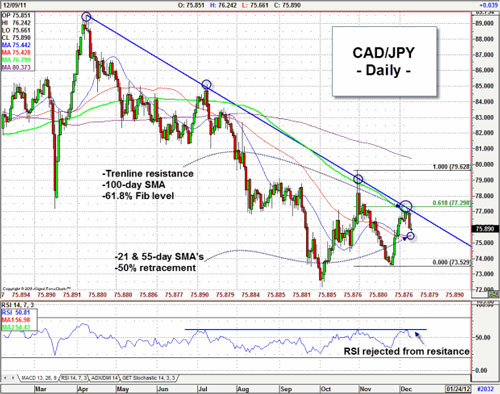
The long term trend line resistance that we noted in last week’s post capped the rally in in CAD/JPY as anticipated. The pair also faced resistance at its 100-day simple moving average and 61.8% Fibonacci retracement of the decline from Oct. high to Nov. lows. It has since moved lower and approaches the convergence of the 21- and 55-day SMA’s as well as the 50% retracement (of the rally from Nov. lows to Dec. highs). These levels converge around 75.40/50 and may serve as an initial support level. A break below here would suggest further downside with the Nov. lows of around 73.50 as the next visible support zone. The daily RSI indicator also points to a bearish bias as the indicator was recently rejected from a horizontal resistance. A move below the 50 level would add to the bearish technical picture. We maintain our view that “while the 77.10/30 area holds as resistance, we would anticipate a further decline in CAD/JPY is an initial move towards the 21 and 55-day SMA’s around the 75.50 zone. A sustained break above the 77.30 level would negate this view”


Latest comments

Loading next article…
Risk Disclosure: Trading in financial instruments and/or cryptocurrencies involves high risks including the risk of losing some, or all, of your investment amount, and may not be suitable for all investors. Prices of cryptocurrencies are extremely volatile and may be affected by external factors such as financial, regulatory or political events. Trading on margin increases the financial risks.
Before deciding to trade in financial instrument or cryptocurrencies you should be fully informed of the risks and costs associated with trading the financial markets, carefully consider your investment objectives, level of experience, and risk appetite, and seek professional advice where needed.
Fusion Media would like to remind you that the data contained in this website is not necessarily real-time nor accurate. The data and prices on the website are not necessarily provided by any market or exchange, but may be provided by market makers, and so prices may not be accurate and may differ from the actual price at any given market, meaning prices are indicative and not appropriate for trading purposes. Fusion Media and any provider of the data contained in this website will not accept liability for any loss or damage as a result of your trading, or your reliance on the information contained within this website.
It is prohibited to use, store, reproduce, display, modify, transmit or distribute the data contained in this website without the explicit prior written permission of Fusion Media and/or the data provider. All intellectual property rights are reserved by the providers and/or the exchange providing the data contained in this website.
Fusion Media may be compensated by the advertisers that appear on the website, based on your interaction with the advertisements or advertisers.
© 2007-2025 - Fusion Media Limited. All Rights Reserved.