Talking Points
- Classic Downtrend Acceleration in CAD/CHF
- Selecting a Risk-Adjusted Zone of Resistance
- The Ideal Time Frame for Selling CAD/CHF
After choppy price action yesterday, today's analysis shows what a difference a day can make in terms of market clarity. In particular, CADCHF is showing what could turn out to be a textbook trade set-up…provided the pair can reach the key level of resistance needed to signal a risk-controlled entry.
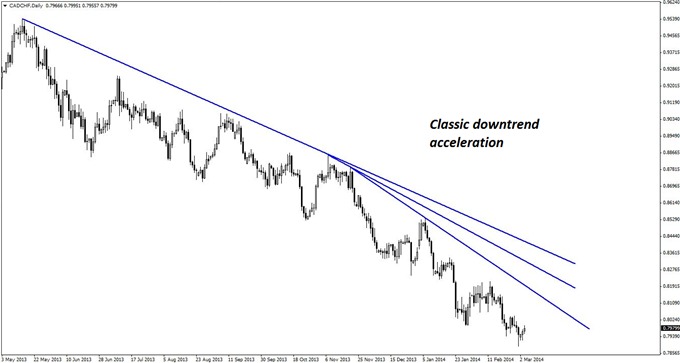
The daily chart below is exhibiting a classic downtrend that is accelerating slightly, but still has yet to shown any signs of parabolic movement, which suggests potential for further downward price action.
At this point, after three days of pulling back to the upside, CADCHF is ripe for at least another down day, if not another formal move down. In all, there is a strong case for a swing trade developing here.
 CAD/CHF Daily Downtrend" title="Acceleration in CAD/CHF Daily Downtrend" align="bottom" border="0" height="242" width="474">
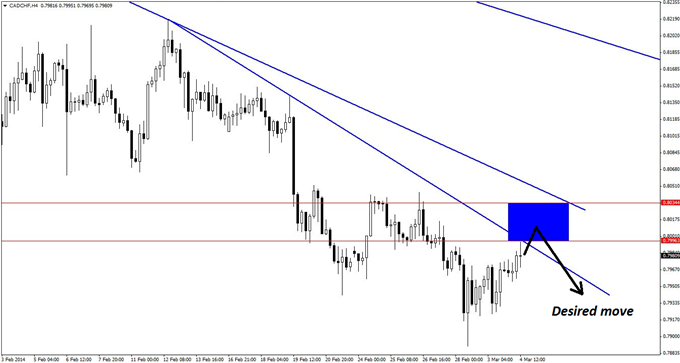
The resistance zone selected on the four-hour chart below may seem surprising to some, as it is somewhat higher than the closest declining line of resistance. One might make the observation that the zone was deliberately drawn slightly higher than the current price, and that’s correct. The reason for this will be discussed later in the context of the hourly chart. On the four-hour chart, however, the resistance zone is 0.7996-0.8034.
 CAD/CHF" title="Key Resistance Zone for Selling CAD/CHF" align="bottom" border="0" height="242" width="474">
This represents risk amounting to 42 pips, which is reasonable, considering that a move to test the previous low would contain at least 100 pips or more. Nonetheless, in order to secure a narrower zone of risk, trade triggers on the hourly chart are preferred.
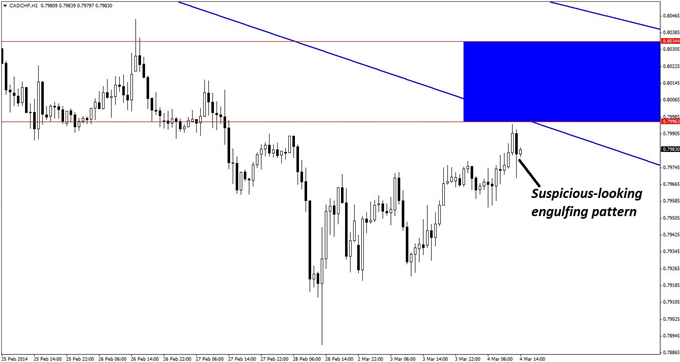
On the hourly chart below, price has just completed an ominous-looking engulfing pattern, which is suspicious because of the long tail at the bottom, which still suggests the presence of buyers in the market. As a result, it would be more prudent to expect another small swipe to the upside. Although price may indeed turn around and head lower from here, the market is still jumpy enough that caution is preferred as the better part of valor, even if it means missing this trade altogether.
 CAD/CHF Entry Signal" title="A Suspicious-Looking CAD/CHF Entry Signal" align="bottom" border="0" height="242" width="474">
The other reason for favoring caution, of course, is because traders are advised to make only two or three attempts to get in on a trade like this one. This would be considered a sub-optimal entry, and one not worthy of wasting one of those attempts. Estimating the key resistance zone slightly higher is another effort to circumvent all of this.
The short-entry triggers that would be acceptable once the key resistance zone is breached would be the usual suspects: bearish engulfing patterns, pin bars, and/or bearish reversal divergence on the hourly chart.
By Kaye Lee, private fund trader and head trader consultant, StraightTalkTrading.com.
