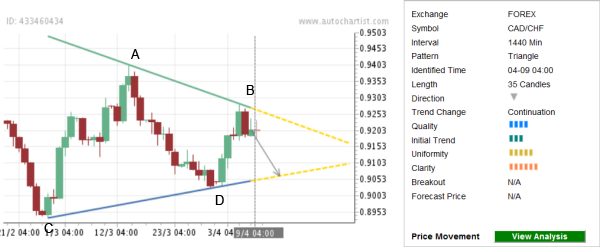
CAD/CHF continues to fall inside the Clear Triangle chart pattern identified on the daily charts. The overall Quality of this chart pattern is rated at the 4-bar level which reflects the following values of the individual contributing Quality indicators: low Initial Trend (rated at the 3-bar level), average Uniformity (5 bars) and higher Clarity (6 bars).
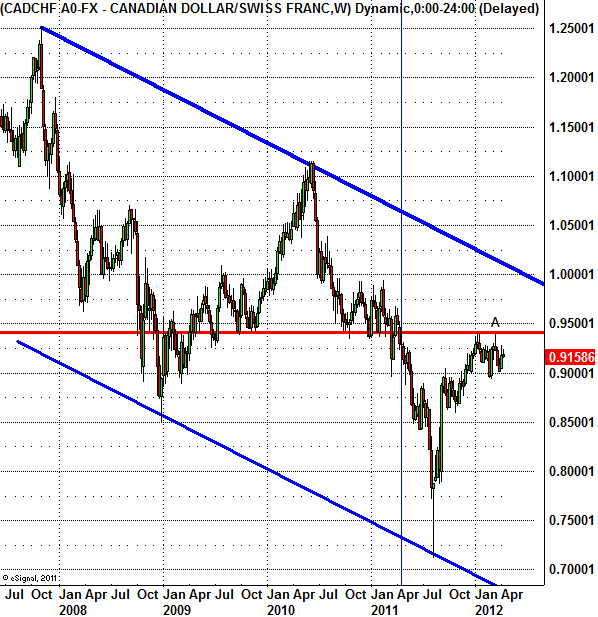
This chart pattern continues the prevailing downtrend visible on the daily and the weekly CAD/CHF charts. The top of this Triangle (point A on the chart below) formed when the pair reversed down from the major level of resistance at 0.9400 (which has been reversing the pair up multiple times over the last few years, acting as the resistance now after having been broken in the middle of last year, as is shown on the second chart below). The pair is expected to fall further toward the lower support trendline of this Triangle.

The following weekly CAD/CHF chart shows the longer-term picture of this currency pair’s movement:
 CAD/CHF" title="CAD/CHF" width="598" height="617" />
This chart pattern continues the prevailing downtrend visible on the daily and the weekly CAD/CHF charts. The top of this Triangle (point A on the chart below) formed when the pair reversed down from the major level of resistance at 0.9400 (which has been reversing the pair up multiple times over the last few years, acting as the resistance now after having been broken in the middle of last year, as is shown on the second chart below). The pair is expected to fall further toward the lower support trendline of this Triangle.

The following weekly CAD/CHF chart shows the longer-term picture of this currency pair’s movement:
 CAD/CHF" title="CAD/CHF" width="598" height="617" />