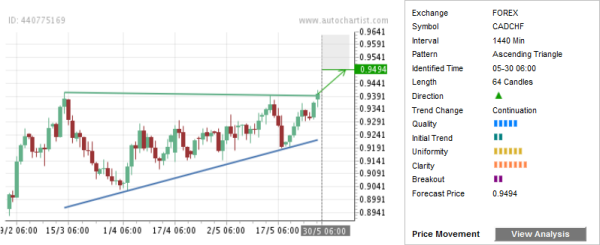
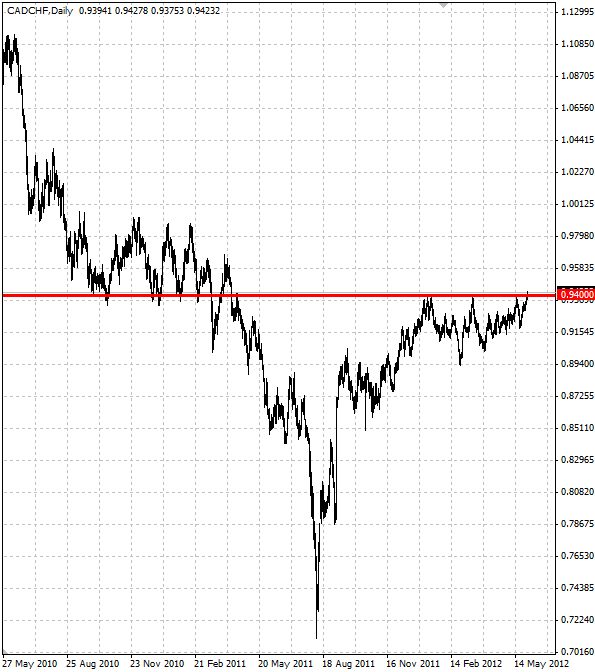
CAD/CHF has recently broken up through the upper resistance trendline of the Ascending Triangle chart pattern identified on the daily charts. The overall Quality of this chart pattern is measured at the 5 bar level as a result of the low Initial Trend (measured at the 2 bar level), above-average Uniformity (6 bars) and higher Clarity (7 bars). The upper resistance trendline of this Ascending Triangle formed along the major resistance price level 0.9400 (which had previously served as a strong support – reversing the pair up numerous times from the 2009 to 2011, as is show on the second chart below). The Breakout of the upper resistance trendline coincided with the breaking of the aforementioned resistance level – which should accelerate the advance of this currency pair toward the Forecast Price 0.9494 in the nearest time.

The following daily CAD/CHF chart shows the previous price action close to the major price level 0.9400:
 CAD/CHF CHART" title="CAD/CHF CHART" width="595" height="672" />

The following daily CAD/CHF chart shows the previous price action close to the major price level 0.9400:
 CAD/CHF CHART" title="CAD/CHF CHART" width="595" height="672" />