Pre-Open Market Analysis
I have been saying since the weekend that there would be a pullback this week. This is because the Emini was testing the major May 16 lower high. Furthermore, there was a parabolic wedge buy climax on the 60 minute chart. Finally, all financial markets will probably pause ahead of next week’s FOMC announcement.
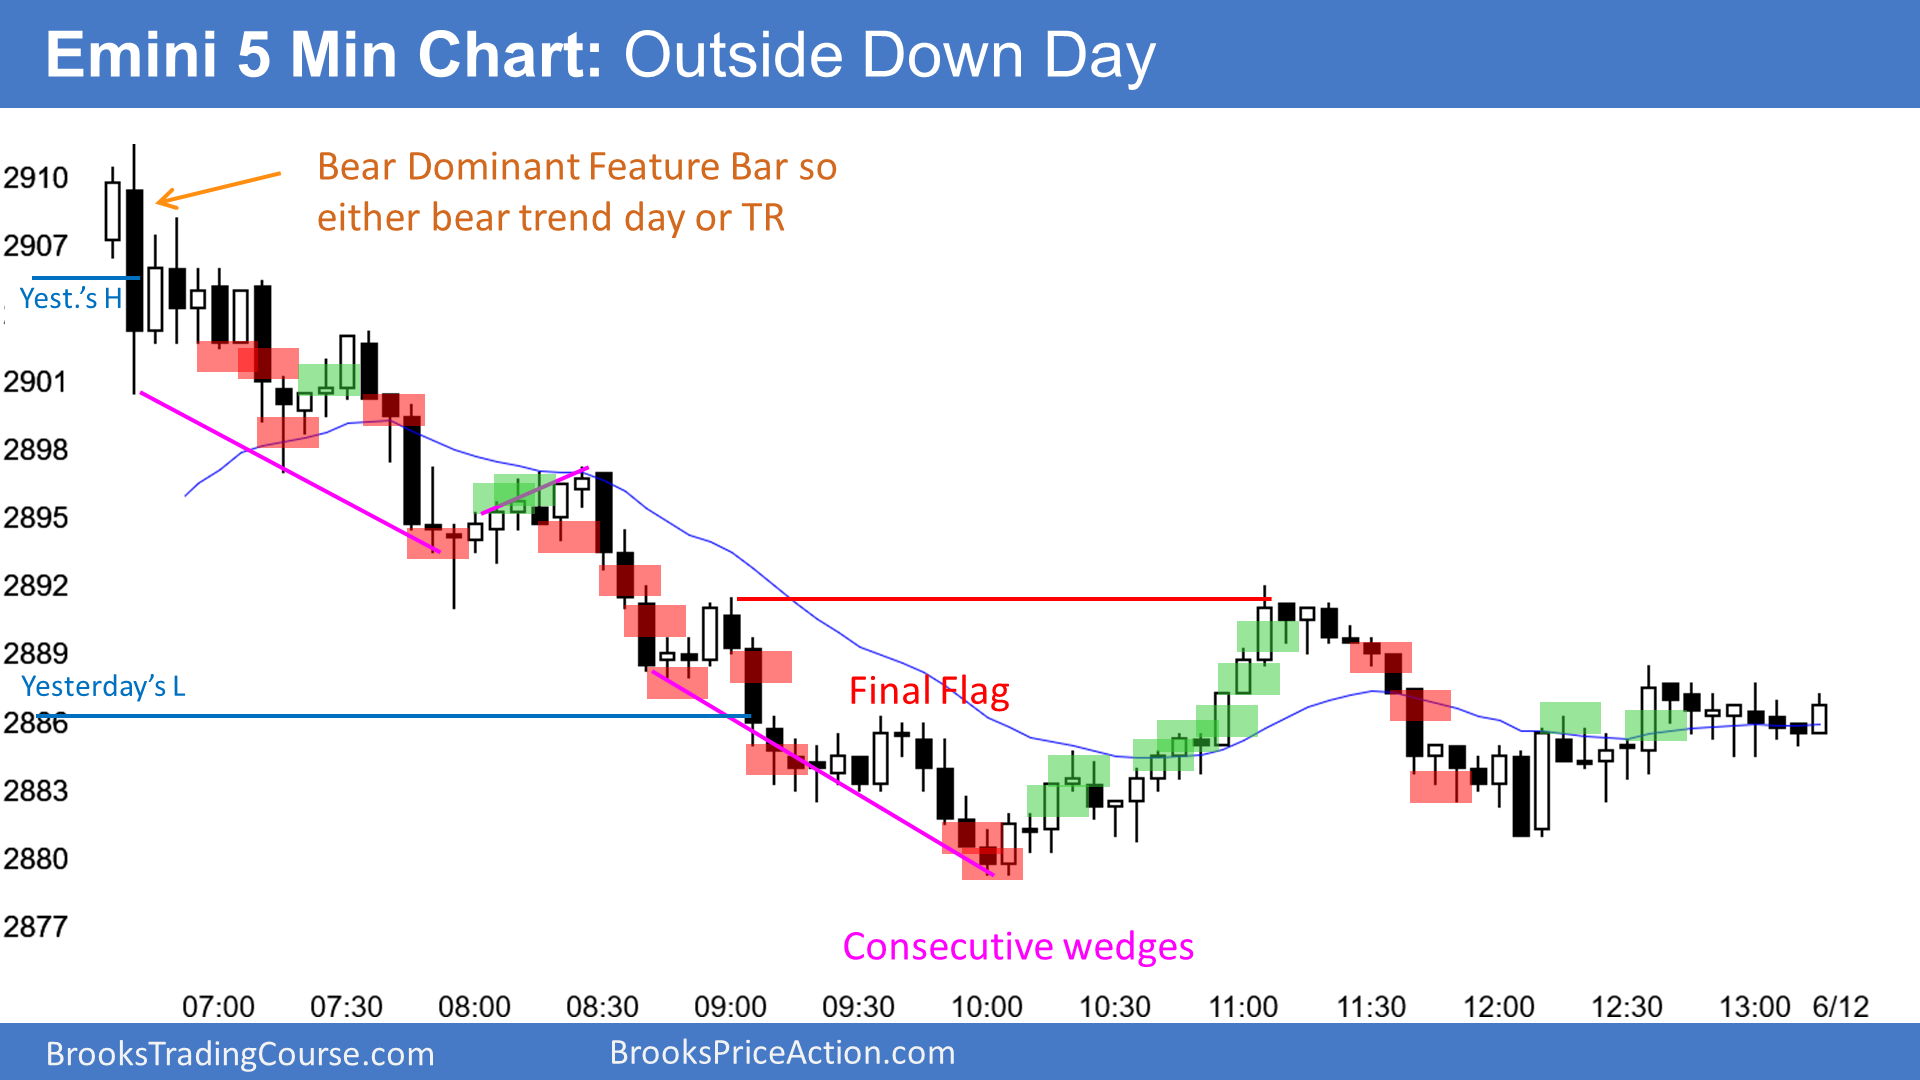
Yesterday was an outside down day. Since there is now a double top with the May 16 high, yesterday is a sell signal bar for today. But after a 6 day rally, the odds are that there will be buyers not far below yesterday’s low. If today triggers the sell signal, the selloff will probably last only 1 – 3 days before the bulls buy again.
Overnight Emini Globex Trading
The Emini is down 5 points in the Globex session. Today therefore might gap below yesterday’s low and the 60-minute EMA.
By trading below yesterday’s low, the Emini would trigger a minor sell signal on the daily chart. Yes, there is a double top with the May 16 high. But the 6 days without a pullback make the 1st reversal down likely to be brief. The bulls will probably buy a 1 – 3 day pullback and try again to work to above the all-time high.
While yesterday was an outside down day, the final 4 hours were in a trading range. In addition, the 60-minute chart has been above its 20-bar moving average for far more than 20 bars. The bulls have been willing to buy far above the average price. There will be many bulls happy to finally get to buy around the average price. This 20 Gap Bar buy signal reduces the chance of a strong reversal down over the next few days.
Since there is a sell signal on the daily chart and a buy signal on the 60 minute chart, the Emini will probably be mostly sideways for a few days. That increases the chance of trading range price action on the daily chart. Traders will therefore look to buy for reversals up after 2 – 3 hour selloffs and sell reversals down from 2 – 3 hour rallies.
Yesterday’s Setups

Here are several reasonable stop entry setups from yesterday. I show each buy entry with a green rectangle and each sell entry with a red rectangle. I rarely also show limit order entries and entries on the close of bars. Buyers of the Brooks Trading Course have access to a much more detailed explanation of the swing trades for each day.
My goal with these charts is to present an Always In perspective. If a trader was trying to be Always In or nearly Always In a position all day, and he was not currently in the market, these entries would be logical times for him to enter.
