
The French CAC 40 benchmark index climbed to 5629 yesterday. The last time it traded above 5600 was in late-December 2007 and while the price is still far from its 6192 all-time high, the current rally is no less significant, especially if we consider that just three months ago the bears dragged the CAC 40 below the 5000 mark. This means the French blue chip index has gained more in the last three months than it did during the entire 2017. The good news is the Elliott Wave Principle put us ahead of this surge, allowing us to take advantage of it. The chart below, included in our previous article about this instrument, explains how this was made possible.
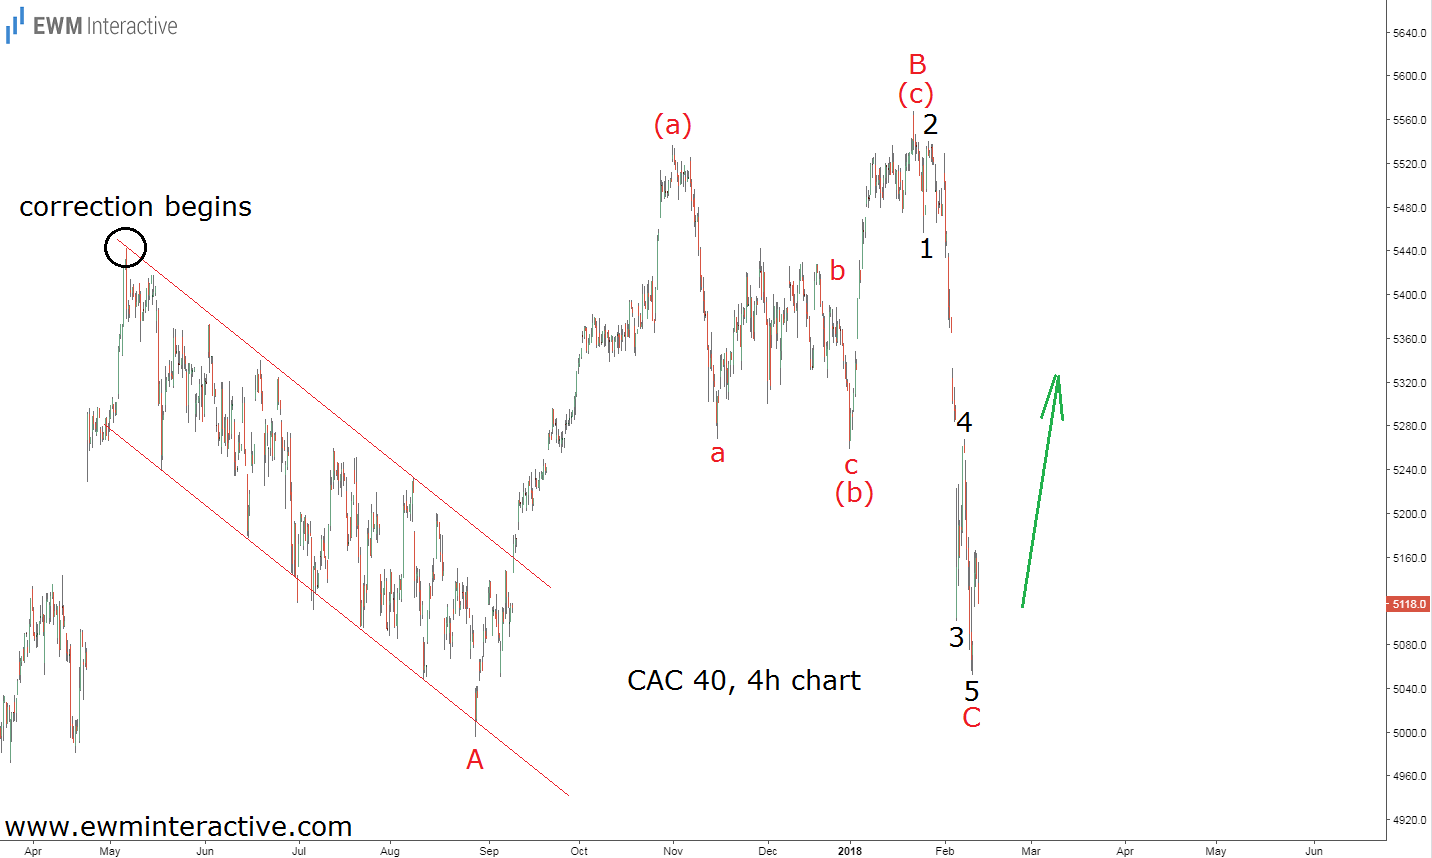
The current rally in the CAC 40 did not came as a surprise to Elliott Wave analysts, because in mid-February its 4-hour chart depicted a corrective pattern, known as a running flat correction. According to the theory, once a correction ends the larger trend resumes. And since the CAC 40 was still in an uptrend on weekly basis, it made sense to expect the bulls to return and lift the index to a new high. However, running flats are rare patterns, which usually evolve into the much more common expanding variety. So, while the price was hovering around 5120 on February 13th, we concluded that even “a slight breach of the 5000 mark would not be enough to invalidate the positive outlook.” The updated chart below shows how the situation has been developing since.
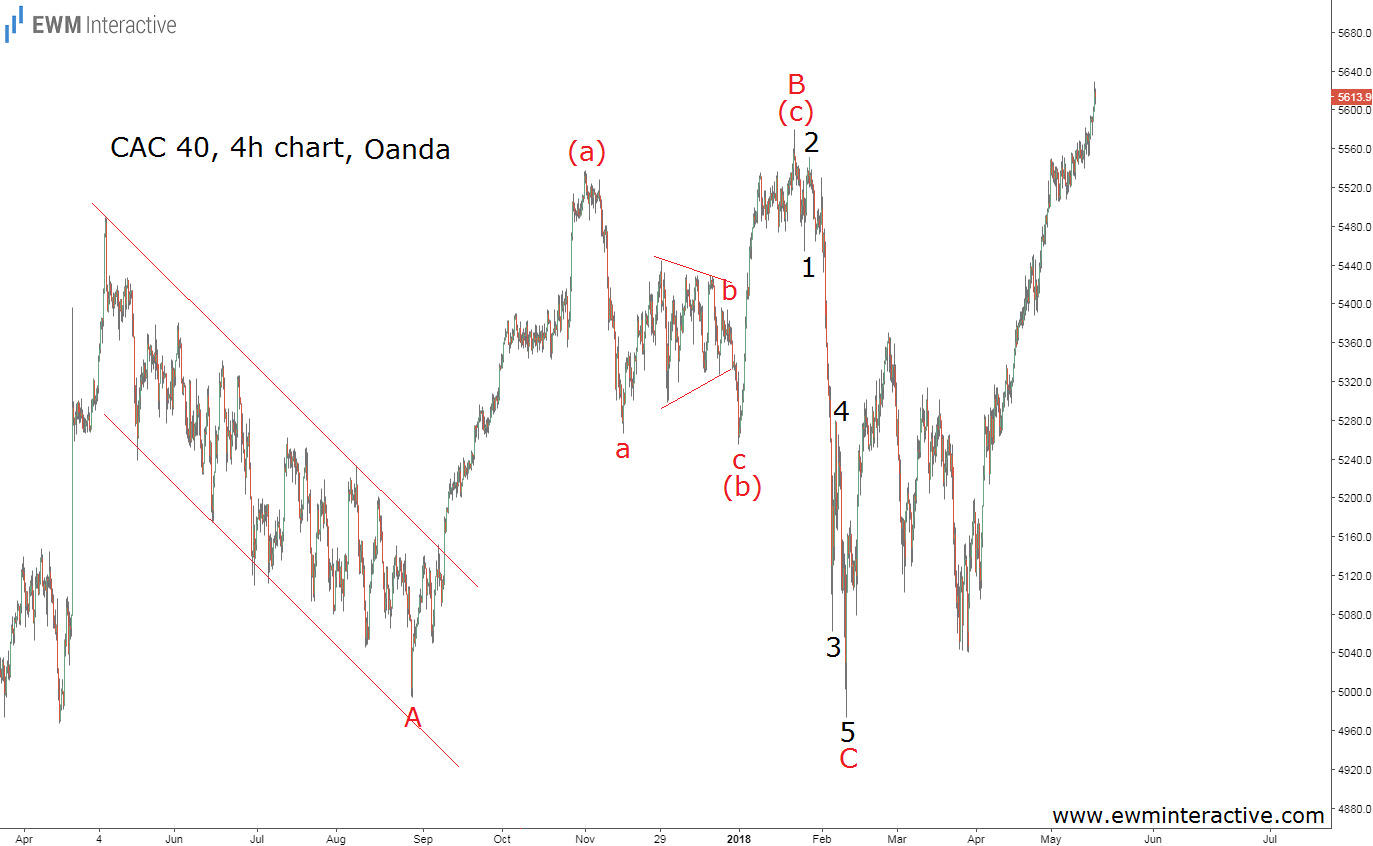
The bears did indeed slightly breach the 5000 level. The bottom was formed at 4973, at least according to Oanda. From then on, nothing could stop the bulls. Does this mean investors could still join them? Or perhaps it is too late? In order to find out, we have to see where does the current rally fit into the bigger picture. The weekly chart will help us with that task.
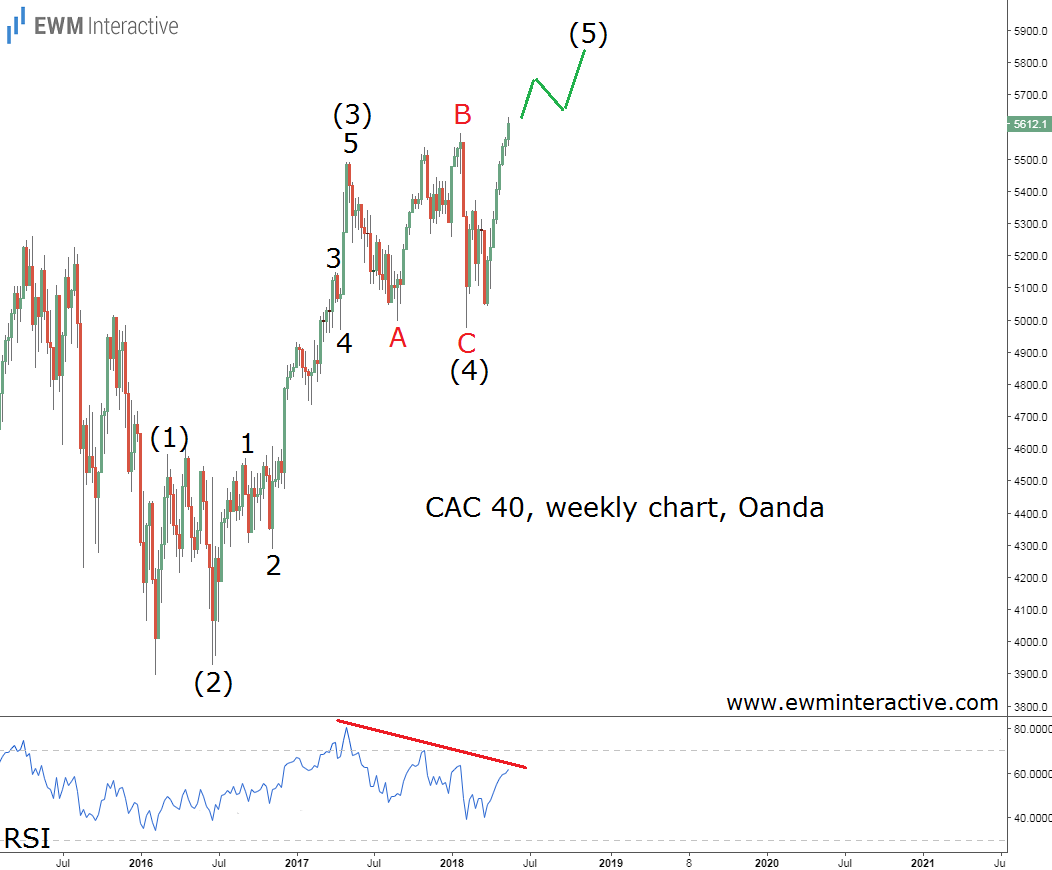
The weekly chart shows the CAC 40’s entire advance since the low at 3894 in February 2016. As visible, its structure looks like a five-wave impulse, whose wave (5) is now approaching its end. The theory states that a three-wave correction follows every impulse, suggesting that once wave (5) is over, a notable decline back to the support area of wave (4) near 5000 should be expected. A strong bearish divergence between waves (5) and (3) on the chart of the RSI indicator also support the negative outlook. If this count is correct, the French CAC 40 might still reach 5800, but investors should proceed with great caution.
- English (UK)
- English (India)
- English (Canada)
- English (Australia)
- English (South Africa)
- English (Philippines)
- English (Nigeria)
- Deutsch
- Español (España)
- Español (México)
- Français
- Italiano
- Nederlands
- Polski
- Português (Portugal)
- Português (Brasil)
- Русский
- Türkçe
- العربية
- Ελληνικά
- Svenska
- Suomi
- עברית
- 日本語
- 한국어
- 简体中文
- 繁體中文
- Bahasa Indonesia
- Bahasa Melayu
- ไทย
- Tiếng Việt
- हिंदी
CAC 40 Reaches Highest Level Since 2007
Latest comments
Loading next article…
Install Our App
Risk Disclosure: Trading in financial instruments and/or cryptocurrencies involves high risks including the risk of losing some, or all, of your investment amount, and may not be suitable for all investors. Prices of cryptocurrencies are extremely volatile and may be affected by external factors such as financial, regulatory or political events. Trading on margin increases the financial risks.
Before deciding to trade in financial instrument or cryptocurrencies you should be fully informed of the risks and costs associated with trading the financial markets, carefully consider your investment objectives, level of experience, and risk appetite, and seek professional advice where needed.
Fusion Media would like to remind you that the data contained in this website is not necessarily real-time nor accurate. The data and prices on the website are not necessarily provided by any market or exchange, but may be provided by market makers, and so prices may not be accurate and may differ from the actual price at any given market, meaning prices are indicative and not appropriate for trading purposes. Fusion Media and any provider of the data contained in this website will not accept liability for any loss or damage as a result of your trading, or your reliance on the information contained within this website.
It is prohibited to use, store, reproduce, display, modify, transmit or distribute the data contained in this website without the explicit prior written permission of Fusion Media and/or the data provider. All intellectual property rights are reserved by the providers and/or the exchange providing the data contained in this website.
Fusion Media may be compensated by the advertisers that appear on the website, based on your interaction with the advertisements or advertisers.
© 2007-2025 - Fusion Media Limited. All Rights Reserved.