Key Takeaway
There are good odds that some of the major European equity indices have not reached their short-term high yet. The French CAC 40 as well as the German DAX show an incomplete Elliott wave pattern to the upside. Both indices recorded their recent highs in a 3-wave swing to the upside. This is a corrective pattern within the Elliott wave framework. It is called an irregular flat. Moreover, an irregular flat results into a high-confidence trading our investment setup.
CAC 40
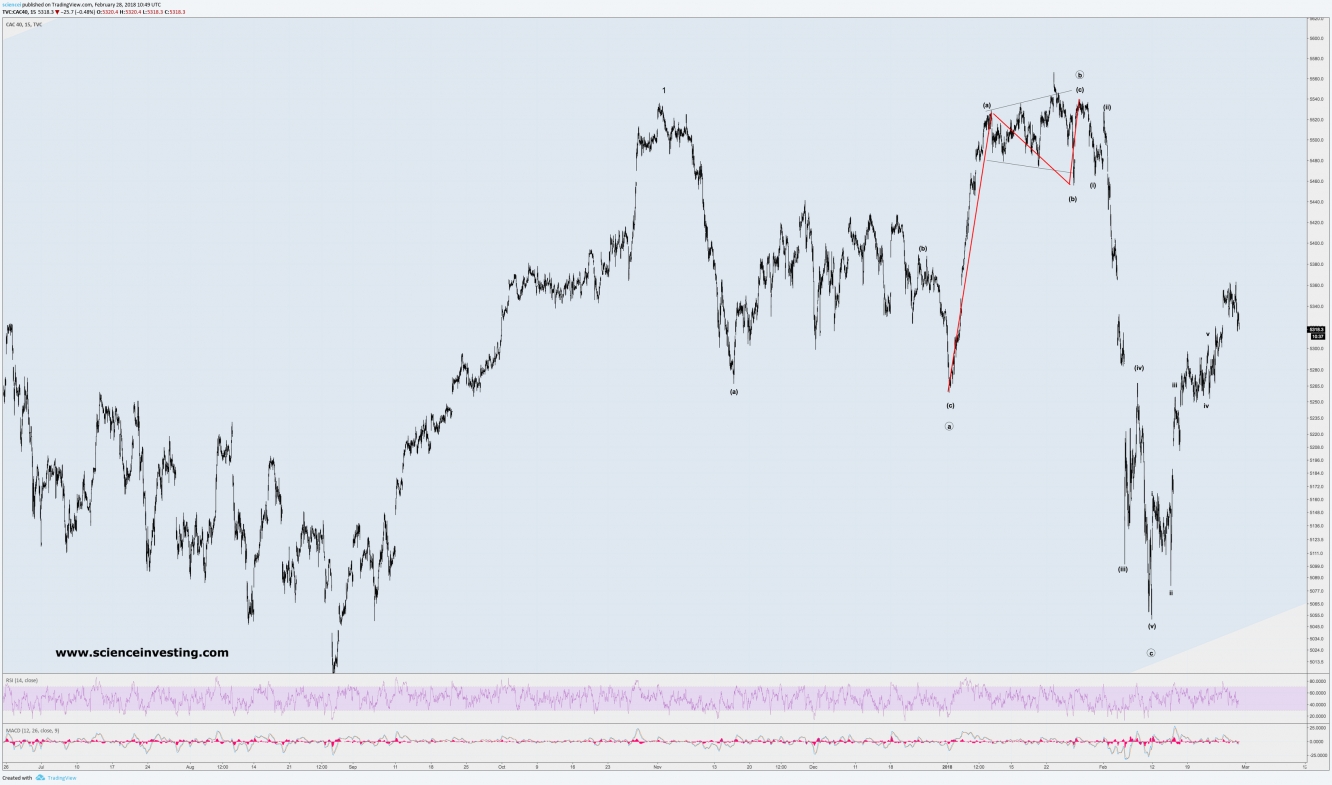
The CAC 40 has not shown a terminal Elliott wave pattern yet. The index shows a clear 3-wave increase into its recent high. This is highlighted in red within our CAC 40 chart on this page. Hence, a significant top is not in as of now. Subsequently, the index completed an impulse into the February lows. This completes a textbook irregular flat pattern in the CAC 40.
We are questioning the exact label of the current irregular flat however. It may be either a second wave of minor degree (our label up until today) or a fourth wave of intermediate degree (maybe even its A-wave). Both versions will have the same implication: The bottom of this irregular flat will be most likely the bottom of both patterns. It is a correction to the paramount trend to the upside. Continuation to the upside is most likely.
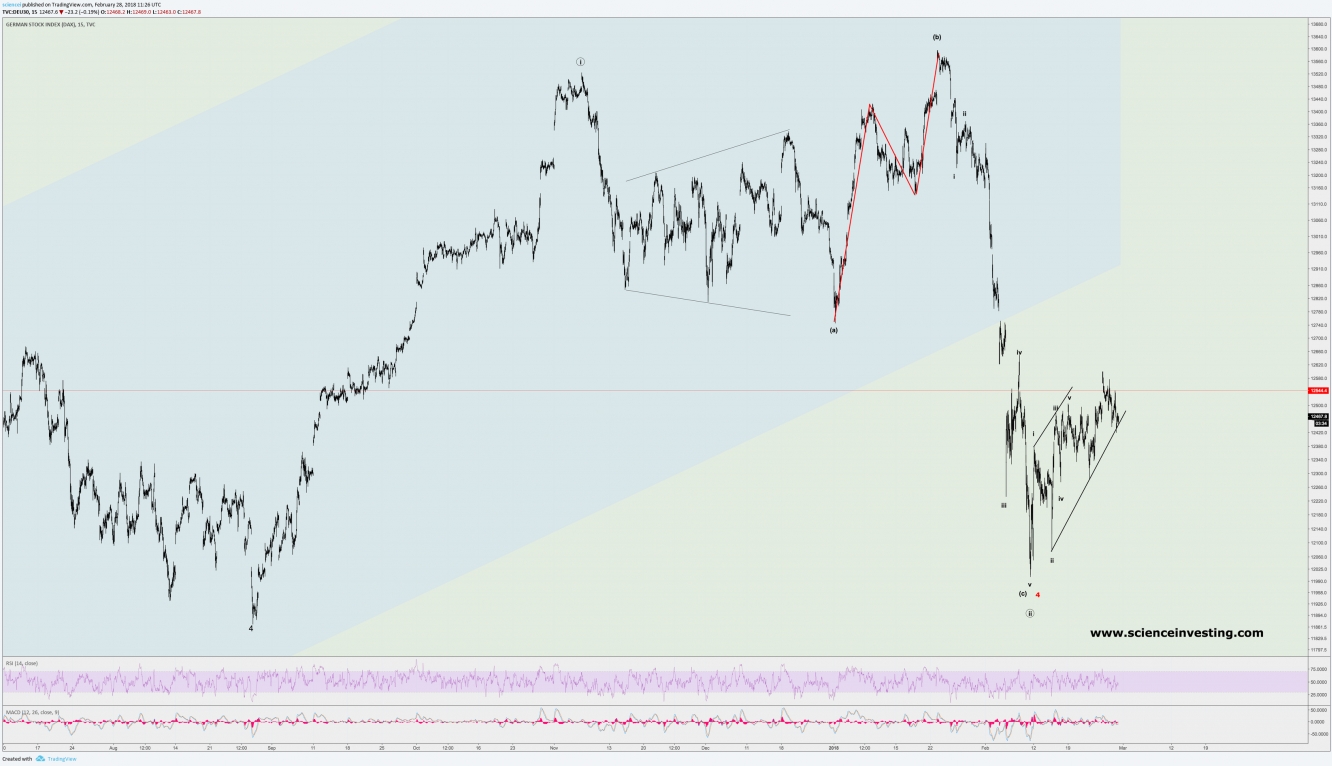
The German equity index DAX shows a very similar pattern to the CAC 40. It went up as well in a 3-wave move into its recent all time high. Subsequently, the DAX completed an impulse into the February lows. We see here also a textbook irregular flat pattern. Again, this is a correction to the paramount trend. The paramount trend is up for the DAX. Hence, we expect to see continuation at some point, which leads into another all time high.
Conclusion
The irregular flat pattern is particularly interesting within the Elliott wave framework. It provides some of the most reliable signals. The main difficulty in applying Elliott wave theory to practice and especially in real time is the ambiguity of the wave count. However, an irregular flat does not leave much room for interpretation. It stands for a corrective pattern. Moreover, it terminates with an impulsive wave. Impulses are much easier to spot on charts than corrective patterns. An irregular flat is therefore a high-confidence trading or investment signal. It developed within two of the major European equity indices very recently.
Disclaimer: The above is a matter of opinion provided for general information purposes only and is not intended as investment advice. Information and analysis above are derived from sources and utilising methods believed to be reliable, but we cannot accept responsibility for any losses you may incur as a result of this analysis. Individuals should consult with their personal financial advisors.


