
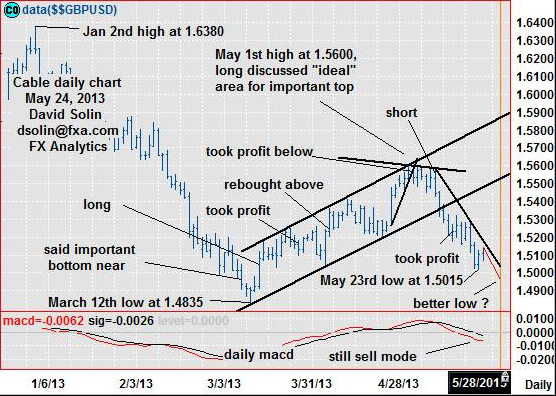
Very bearish view unchanged as the market has continued sharply lower from the long discussed "ideal" area for an important top at 1.5600
(May 1st high, 50% from the Jan high at 1.6380, and then the ceiling of the bullish channel since March), on way back to the March low and 1.4835 and significantly below (see longer term below). Note that the seasonal chart continues lower into late June (see 3rd chart below), technicals remain weak (see sell mode on daily macd at bottom of chart below), and the nearer term downside pattern is still not "complete" (see my scrolling blog at http://www.fxa.com/solin/comments.htm, email me at dsolin@fxa.com if you need a password), with all suggesting further downside. But the market is getting oversold after the tumble from the May 1st high at 1.5600, and suggests that risk is starting to rise for a few weeks of consolidating. Nearby support is seen at the recent 1.5000/15 low and the long term bullish trendline from Nov Jan 2009 (currently at 1.4875/00), while resistance is seen at the bear trendline from May 9th (currently at 1.5165/80).
Strategy/Position
Took profit on the May 8th sell at 1.5580 on the May-15 close above 1.5225 (closed at 1.5235 for 345 ticks). At this point with further downside favored, would reshort here (currently at 1.5125). However, with further near term weakness potentially limited (before forming a bottom for a few weeks), will want to use an aggressive stop on a close 25 ticks above that bearish trendline from May 9th (also falling rapidly to compensate for the increasing near term risk for a bottom).
Long-Term Outlook
Very bearish, very long held long term outlook remains as the market did finally resolve lower from the large triangle that had been forming since Jan 2009 in Feb. As been discussing, these are seen as continuation patterns (arguing the downside resolution), and with eventual declines all the way back to the start of the pattern at 1.3505 and below. Also as mentioned above, the market did indeed turn sharply lower from the key 1.5600 area, and targets declines below the March-12 low at 1.4835 (and likely significantly lower in the longer term).
Strategy/Position
With significantly lower, big picture levels still favored ahead (though will be no doubt be good sized, countertrend bounces along the way), would maintain the longer term bearish bias that was put in place on May 8 at 1.5580.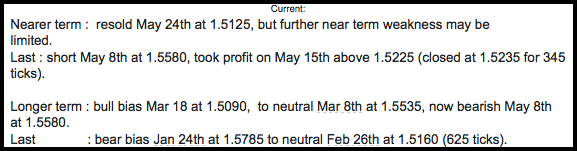
 GBP/USD: Daily" width="556" height="396">
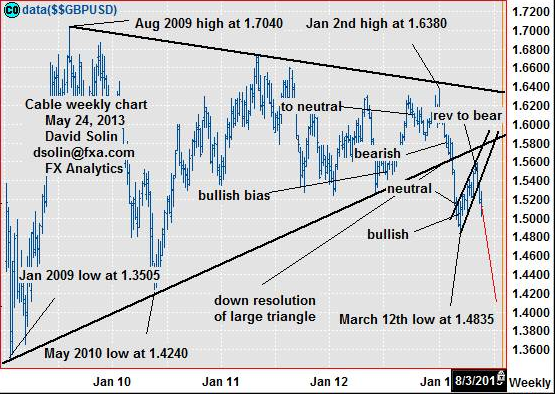 GBP/USD: Weekly" width="555" height="394">
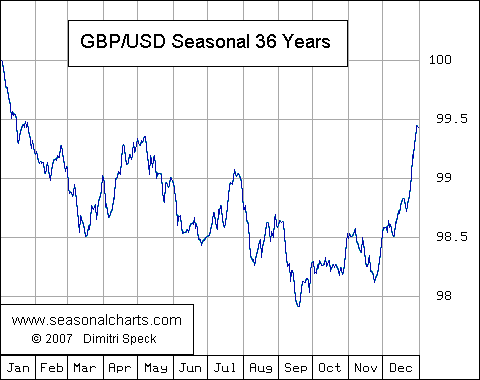 GBP/USD" width="480" height="380">