Cable Consolidates Before Breakout

Published 07/27/2015, 02:06 AM
Updated 05/14/2017, 06:45 AM
USD/GBP
-

The fundamentals have not been as kind to the cable at the end of last week as many had hoped and that led to a big fall. The technicals show a large consolidating pennant shape that could see a strong breakout.

The pound opened last week on the front foot as the bullish sentiment continued from the previous week on comments from the Bank of England hinting as a possible rate rise. That sentiment was reversed when retail sales missed estimates of 0.4% to come in at -0.2%. The BoE is unlikely to raise rates while consumption is in a weakening cycle.

GDP is the standout feature of the economic calendar for the pound in the coming week. The market is forecasting a solid 0.7% q/q which would be a strong result and could see last week's losses regained. The US FOMC will likely add volatility to the market, especially if they talk up a rate rise in September. Also keep an eye on US Durable Goods and Consumer Confidence figures as they could shift the cable.
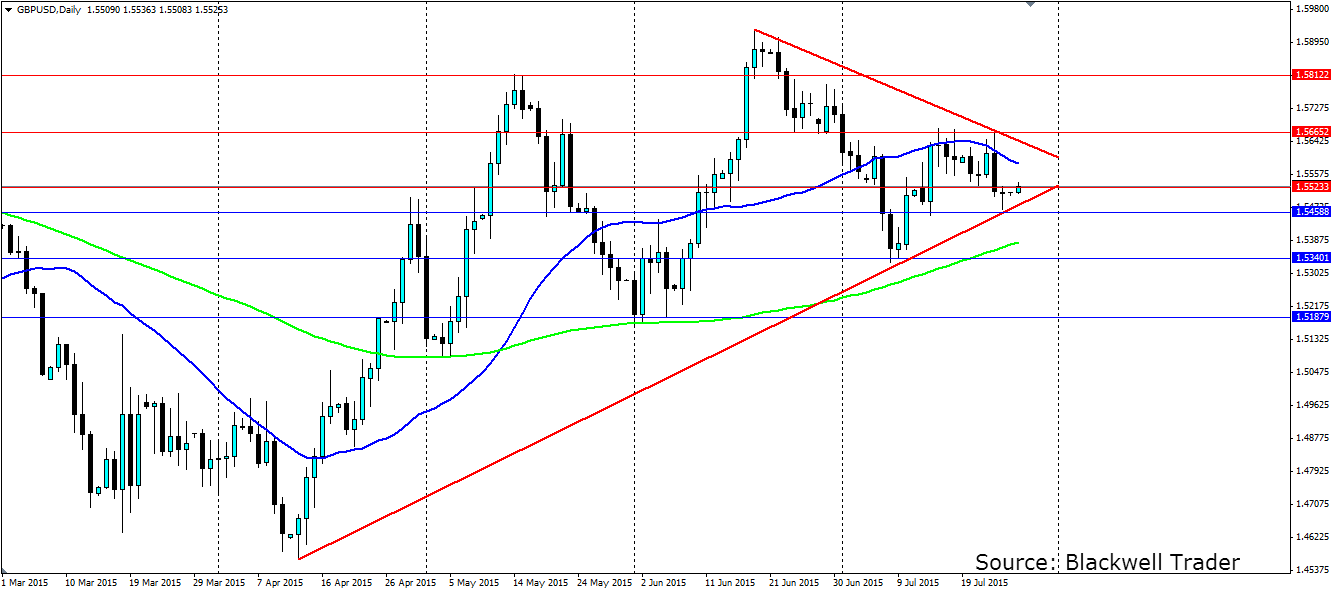
GBP/USD Daily Chart

On the charts the cable has been consolidating in a pennant flag pattern that is likely to continue for the next few days. A bearish trend line formed from the lower high, and a bullish trend line formed from several higher swing lows are converging on each other with the pound stuck in between. Interestingly the two MAs (20 and 100 day) on the chart are also adding to the consolidation pressure which will keep the cable in check before a large breakout shifts the pair.

If we see a bullish breakout, which is the likely scenario given the overall bullish sentiment, we could very well see the recent highs near the 1.6000 handle tested. Conversely, a bearish break will likely seek out the 1.5187 lows as a target. Either way a breakout is set to be a large one given the size of the structure. Support is found at 1.5458, 1.5340 and 1.5187 with the bullish trend line also providing dynamic support. Resistance is found at 1.5523, 1.5665 and 1.5812 with the bearish trend acting as dynamic resistance.

Latest comments

Loading next article…
Risk Disclosure: Trading in financial instruments and/or cryptocurrencies involves high risks including the risk of losing some, or all, of your investment amount, and may not be suitable for all investors. Prices of cryptocurrencies are extremely volatile and may be affected by external factors such as financial, regulatory or political events. Trading on margin increases the financial risks.
Before deciding to trade in financial instrument or cryptocurrencies you should be fully informed of the risks and costs associated with trading the financial markets, carefully consider your investment objectives, level of experience, and risk appetite, and seek professional advice where needed.
Fusion Media would like to remind you that the data contained in this website is not necessarily real-time nor accurate. The data and prices on the website are not necessarily provided by any market or exchange, but may be provided by market makers, and so prices may not be accurate and may differ from the actual price at any given market, meaning prices are indicative and not appropriate for trading purposes. Fusion Media and any provider of the data contained in this website will not accept liability for any loss or damage as a result of your trading, or your reliance on the information contained within this website.
It is prohibited to use, store, reproduce, display, modify, transmit or distribute the data contained in this website without the explicit prior written permission of Fusion Media and/or the data provider. All intellectual property rights are reserved by the providers and/or the exchange providing the data contained in this website.
Fusion Media may be compensated by the advertisers that appear on the website, based on your interaction with the advertisements or advertisers.
© 2007-2025 - Fusion Media Limited. All Rights Reserved.