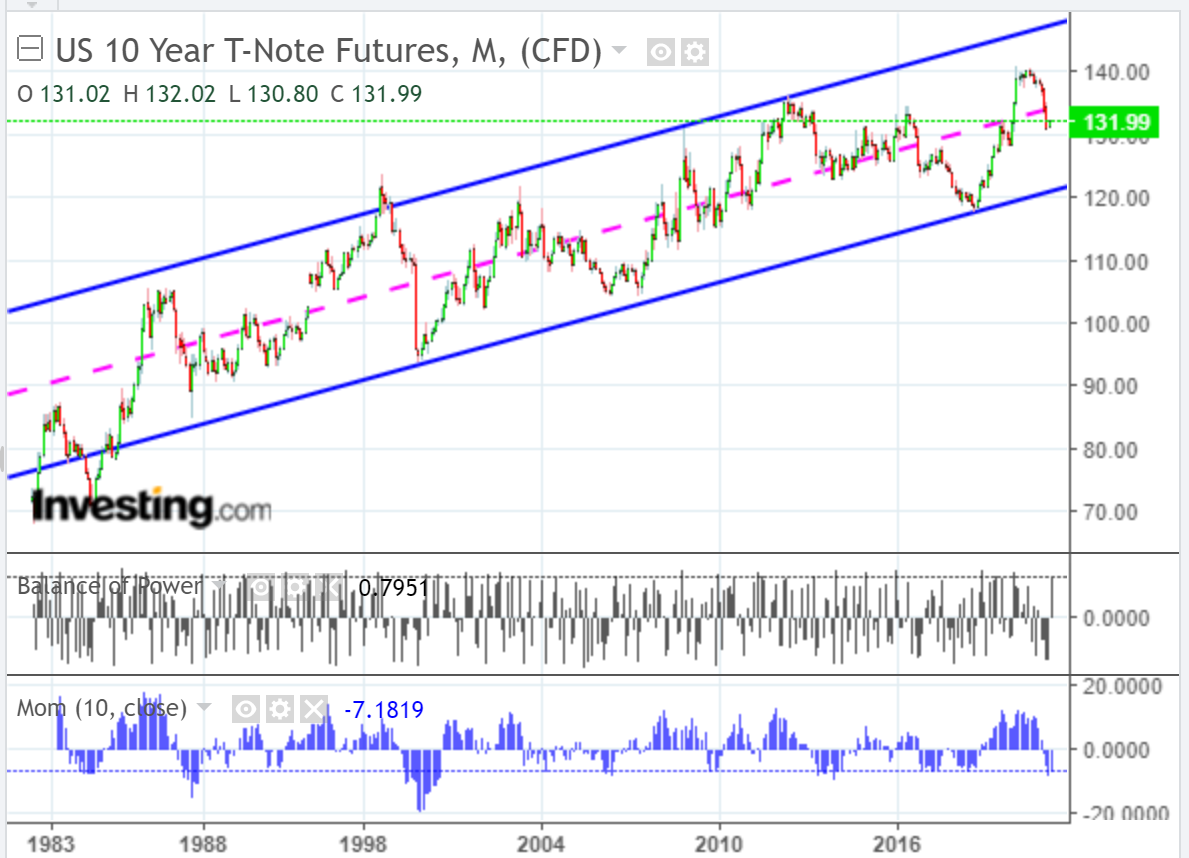
Over the past several days, buying interest has resumed in US 10-year T-Notes, after it fell below its long-term uptrend channel median, as shown on the following monthly chart.
Major resistance lies around 134.00, the channel median. A rally and hold above that level could see serious buying push the price to the channel top, currently around 147.00.
Otherwise, failure to retake the median could see price drop down to major support around 121.00, the channel bottom.
Keep an eye on the Balance of Power and Momentum indicators for clues.

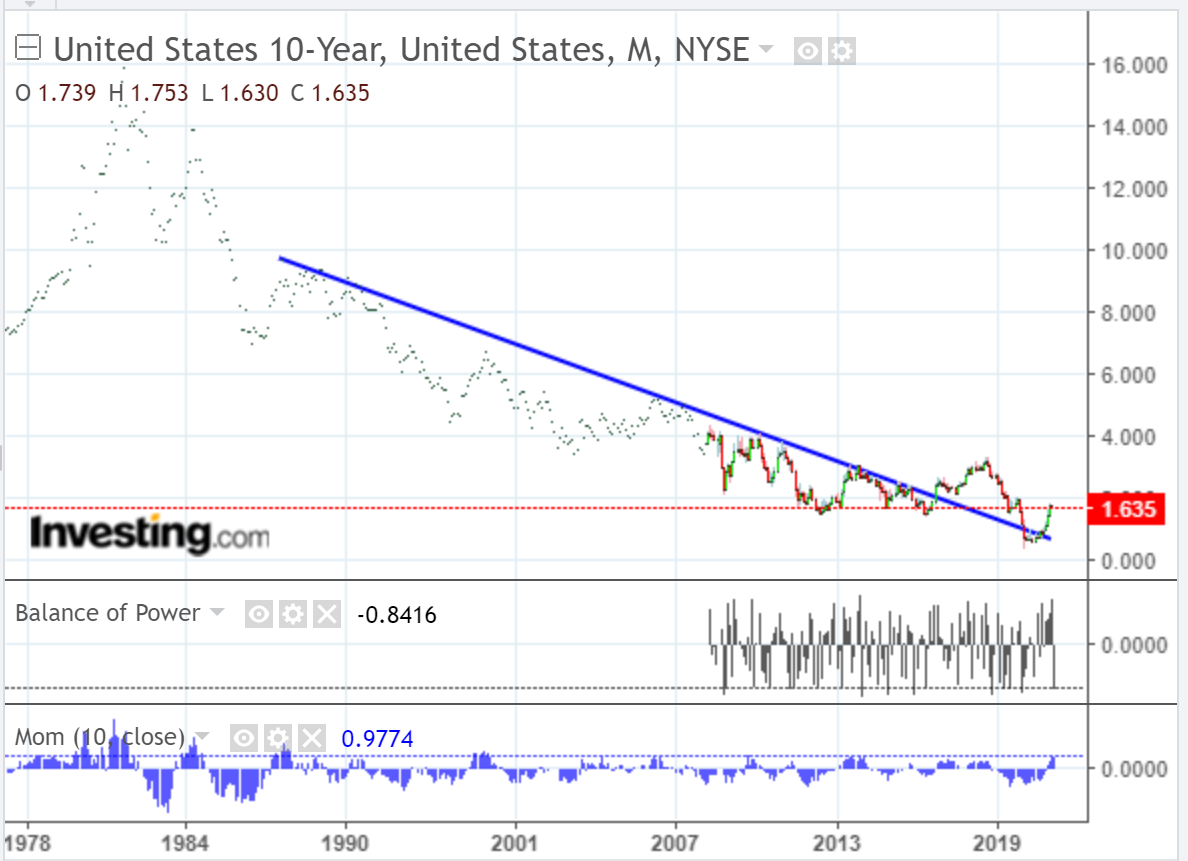
Conversely, keep an eye on the US10YT, last mentioned in my post of February 25...see monthly chart below.
10-Year yields have been fairly volatile since October 2016, after breaking above the long-term downtrend line from 1987.
The Balance of Power abruptly shifted in April from buyers to sellers and Momentum has begun to waver. Near-term price support sits around 1.50%. A drop and hold below that level could see a retest of prior swing lows...around 0.50%.
So, not only is price action important on both of these charts, but the Balance of Power and Momentum indicators hold clues as to the strength of their respective, and normally-opposite, trends. For example, the 10-Year Treasury Yield has broken above its long-standing downtrend...whereas the US 10-Year T-Note is still contained within its channel, in uptrend, so far...perhaps signalling higher yields ahead, even if bulls continue buying the 10-Year T-Note, possibly at a slower pace. So, keep an eye on these two indicators for clues.

