Buying Past Breakout Levels To Make Money

Published 04/14/2017, 01:06 AM
Updated 05/14/2017, 06:45 AM

Many traders and investors are always talking about a story or press releases from a particular company. In fact, if you watch CNBC, Bloomberg or Fox Business News you will always hear why such and such a stock is going to move higher. There always seems to be a catalyst or story behind the coming move higher for the particular equity that is being touted. Rarely, will the talking head in the financial media talk about chart reading or technical analysis.

Let's take a look at a stock which has very good chart support coming up for a potential trade. The name of the company is Jacobs Engineering Group Inc (NYSE:JEC). This stock has been selling off since late January when it traded as high as $63.42 a share. Today, Jacobs Engineering Group Inc stock is trading at $53.48 a share. This is obviously a significant pullback in the share price of JEC stock. So where is the buy level for JEC stock since it has declined so much? Well, this is when we want to look at the weekly chart to see if the there is technical reason for a bounce higher or for the selling to stop. The first thing that traders should note on the weekly chart is that the 200-weekly moving average sits at $50.62 a share. This level also happens to coincide with the November 2016 breakout. Now this is what a technical chart reader would call institutional sponsorship. This trade level is where I would be a buyer of JEC stock. Now, patiently wait for the equity to trade down to the $50.62 area on the chart.

Institutional traders and investors will generally support stocks and markets at these prior breakout levels. This same technique can often be applied on multiple time-frames for day trading, swing trading and investing. Obviously, you will and should test this method first, but with some practice you will find this tactic to be extremely useful when trading all equities.
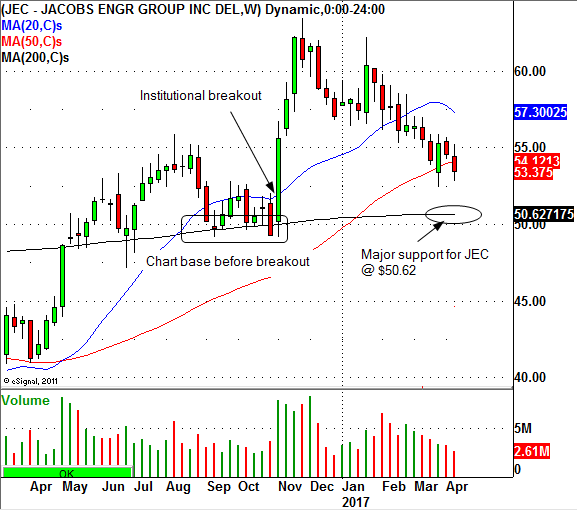
JEC Chart

Latest comments

Loading next article…
Risk Disclosure: Trading in financial instruments and/or cryptocurrencies involves high risks including the risk of losing some, or all, of your investment amount, and may not be suitable for all investors. Prices of cryptocurrencies are extremely volatile and may be affected by external factors such as financial, regulatory or political events. Trading on margin increases the financial risks.
Before deciding to trade in financial instrument or cryptocurrencies you should be fully informed of the risks and costs associated with trading the financial markets, carefully consider your investment objectives, level of experience, and risk appetite, and seek professional advice where needed.
Fusion Media would like to remind you that the data contained in this website is not necessarily real-time nor accurate. The data and prices on the website are not necessarily provided by any market or exchange, but may be provided by market makers, and so prices may not be accurate and may differ from the actual price at any given market, meaning prices are indicative and not appropriate for trading purposes. Fusion Media and any provider of the data contained in this website will not accept liability for any loss or damage as a result of your trading, or your reliance on the information contained within this website.
It is prohibited to use, store, reproduce, display, modify, transmit or distribute the data contained in this website without the explicit prior written permission of Fusion Media and/or the data provider. All intellectual property rights are reserved by the providers and/or the exchange providing the data contained in this website.
Fusion Media may be compensated by the advertisers that appear on the website, based on your interaction with the advertisements or advertisers.
© 2007-2025 - Fusion Media Limited. All Rights Reserved.