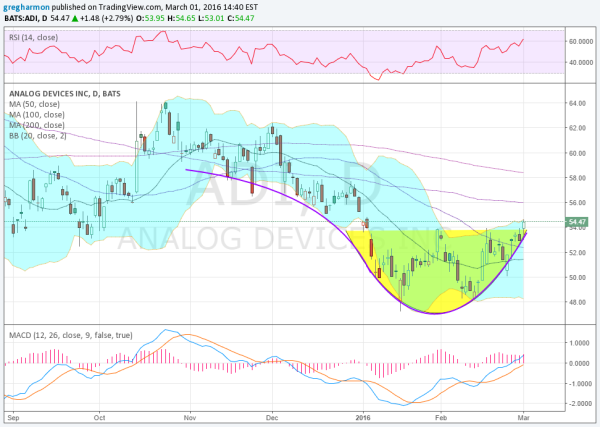
Many stock price charts show a slow grinding pullback that started in November and picked up steam into December before accelerating into January. From that point they made a bottom into mid February and started higher. This price action resembles a ladle or as I prefer one of those new chips specially made for picking up dip.
I don’t know if some classical technician has a name for this pattern but I call it a chilli dip. And it is a buy signal. Below is an example of a chilli dip in Analog Devices (NASDAQ:ADI). The chart shows that roll over that accelerated into the bottom and has now rounded up and breaking resistance. The move over 54 Tuesday is the trigger.
The momentum has been supportive of this reversal ever since mid January. That is when first the RSI turned higher and then the MACD followed. Both are now bullish and continue higher. The Bollinger Bands® could still open a bit to make the case more broadly for more upside. The ride may extend for some time or end shortly, I don’t know. But the next real area for some resistance looks to be at about 58 then 61. So why not try some chilli dip for a possible 10% gain.
Disclaimer: The information in this blog post represents my own opinions and does not contain a recommendation for any particular security or investment. I or my affiliates may hold positions or other interests in securities mentioned in the Blog. Please see my Disclaimer page for my full disclaimer.

