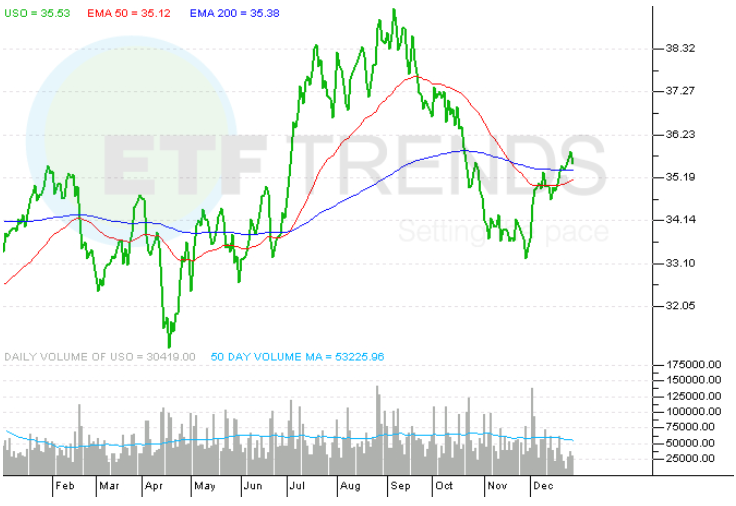
Crude oil slipped below 98 (-0.60%) during the US morning trading session. On the New York Mercantile Exchange, crude oil futures for February delivery declined by 0.60% while trading at USD 97.83 a barrel. US Crude Oil futures rose 7.2% in 2013, one of the better performances for any commodity this year. Oil prices climbed above $100 a barrel for the first time in two months last week after a government storage report showed more robust demand for crude oil and petroleum products than analysts had expected.
The USO tracks the price performance on front-month WTI futures contracts. Consequently, if longer-dated contracts cost more than near-term contracts, investors face potentially lower returns as the ETF rolls futures contracts. The Energy Information Administration is due to release its storage report for the week ending on Dec. 27 at 11 a.m. EST. On Friday U.S. Crude-oil stocks are expected to drop by 2.2 million barrels. The American Petroleum Institute, an industry group, said its own data showed that oil supplies fell by 5.7 million barrels last week, according to an industry source. The API also reported that gasoline stockpiles rose by 3.3 million barrels and distillate stocks increased by 2.6 million barrels, according to the source.
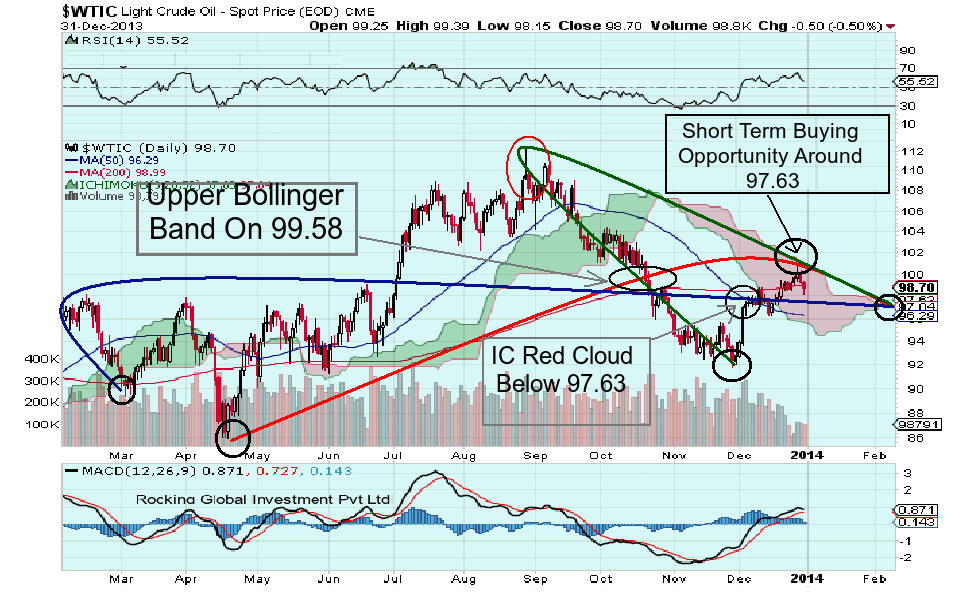
Crude oil created a Symmetrical triangle in an uptrend which indicates that crude oil in the short to medium term trend improved, and will continue on near the main support to 97.63. You can see more selling pressure level 97 and 96.29 if crude break its crucial support 97.63 and close in it. Nymex Oil closed below the 200 DMA support which is a negative sign for the short term. The Upper Bollinger band opened above 99.58 so you can focus on 99.58 as a near main resistance for the short term. You can see more upside level at 100.22 and 100.83 if crude oil crosses near main resistance 99.58 and close on it. ICHIMOKU Green Cloud Once again opened around 98.16 during the last trading session. Short term green cloud completed around 100 so short to medium term traders buy at decline with strict SL. RSI, MACD and ROC are trying to come out from the overbought phase which is more positive for Medium term boom.
