US Treasury Bonds have been a bit of a yo-yo lately. Moving up and down as market expectations for a change in monetary policy are built up and then crushed. Now the market is expecting an FOMC decision to raise rates in December. Will it happen? I do not know.
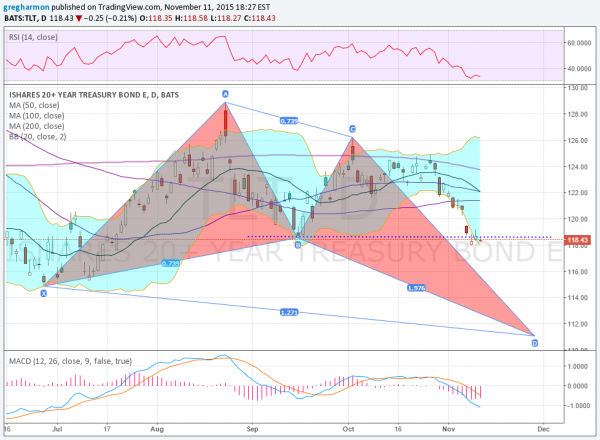
Bu the chart of the iShares 20+ Year Treasury Bond (N:TLT) sure thinks it is going to happen. I know what you are thinking, this has happened before and I just wrote it above. But there are some big differences in the chart this time. Take a look.

Most prominent is the bullish Butterfly harmonic in play. The Potential Reversal Zone lower is at 111, another 7% lower. The price has also fallen below the September low as it consolidates, moving back into the expanding Bollinger Bands®. The RSI finally broke below the bullish zone, and is holding above oversold territory. In September the RSI held at the edge of the bullish zone. The MACD just continues lower. The bond market is getting ready for higher rates, are you?
The information in this blog post represents my own opinions and does not contain a recommendation for any particular security or investment. I or my affiliates may hold positions or other interests in securities mentioned in the Blog, please see my Disclaimer page for my full disclaimer.
