NVDA Q3 Earnings Alert: Why our AI stock picker is still holding Nvidia stockRead More

'Burdened By the Facts' Stock Market (and Sentiment Results)

Published 06/29/2023, 10:56 AM
Updated 07/09/2023, 06:31 AM

On Friday, I joined Seana Smith on Yahoo! Finance. Thanks to Sarah Smith and Seana for having me on the show. Watch this clip to get the playbook for the next 6 months:

Watch in HD directly on Yahoo! Finance

This chart ties in one of the key points I made above:
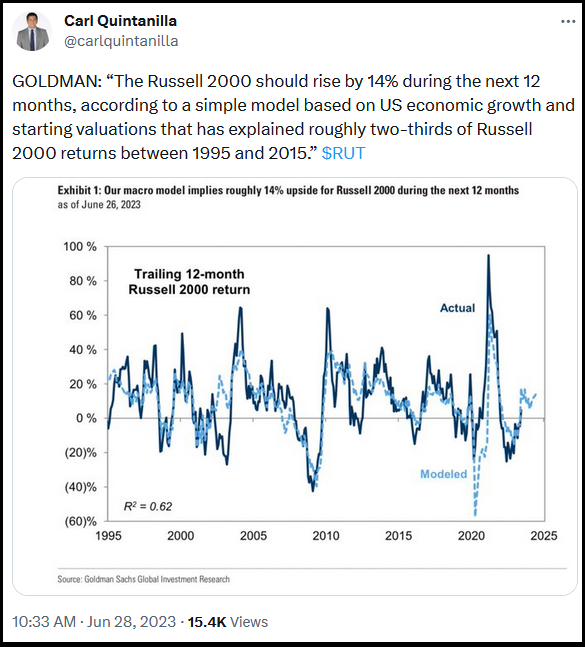
Our macro model implies roughly 14% unside for Russell 2000 during

Some Picks

Last night, I joined Phil Yin on CGTN America. Thanks to Toufic Gebran and Phil for having me on the show. As always, Phil asked me for some stock picks along with my view of economic developments, so here they are:

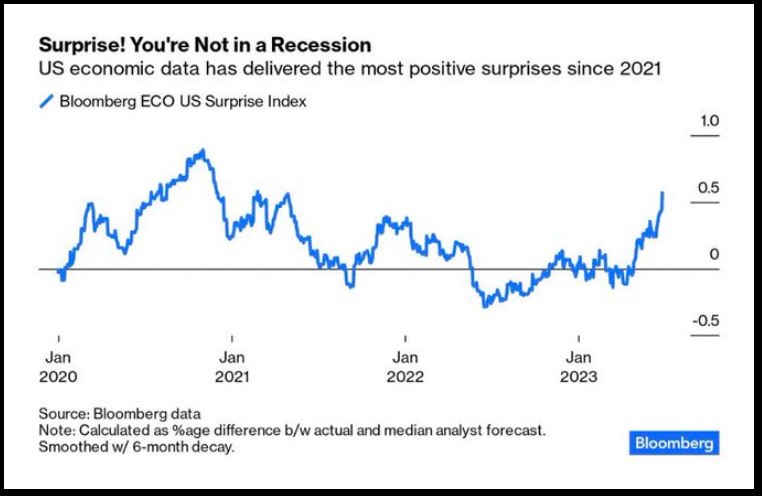
The purpose of the following charts and tables is to remind skeptics that the data continues to come in better than expected. While the back half of the year returns for the indices may be more muted than the first half, there is still significant opportunity. However, the most money will be made “under the surface” with dozens of individual laggards that can be up 20, 30, 50 and even 100%+ in 2H.

Positioning

Commercials still long, Hedge Funds still short the whole way up! We continue to follow the commercials and ignore the large managers who told you to sell at the October lows.
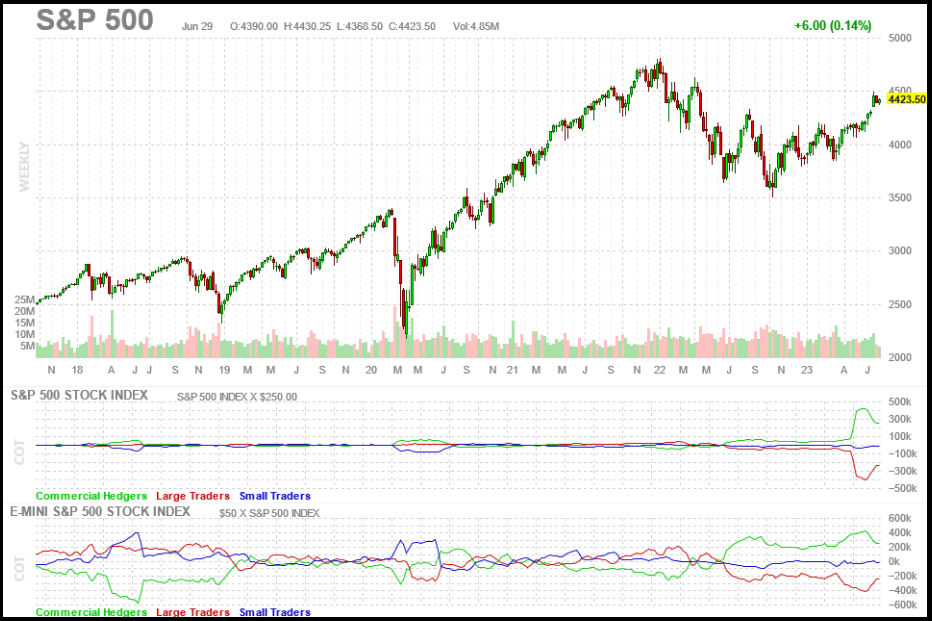
S&P 500

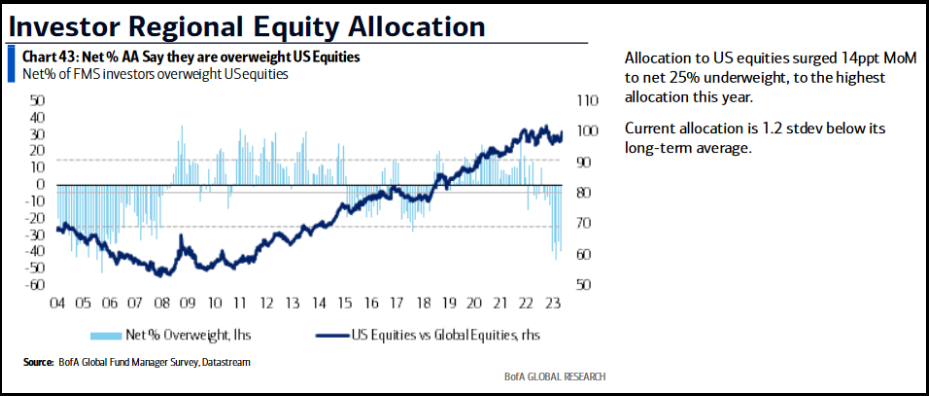
Investor Regional Equity Allocation

Sentiment

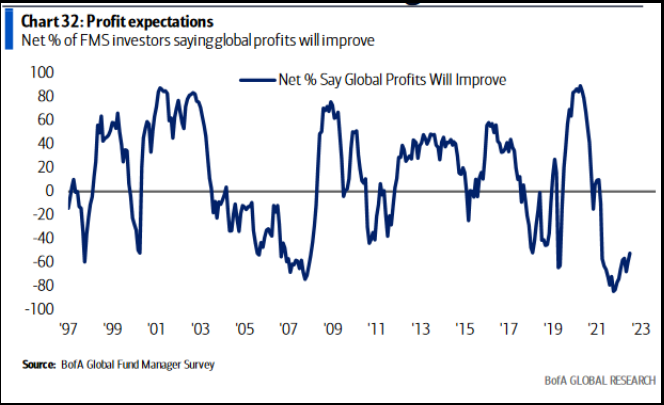
Profit expectations

Bof A Bull & Bear Indicator / BofA B&B indicator / BofA Bull & Bear

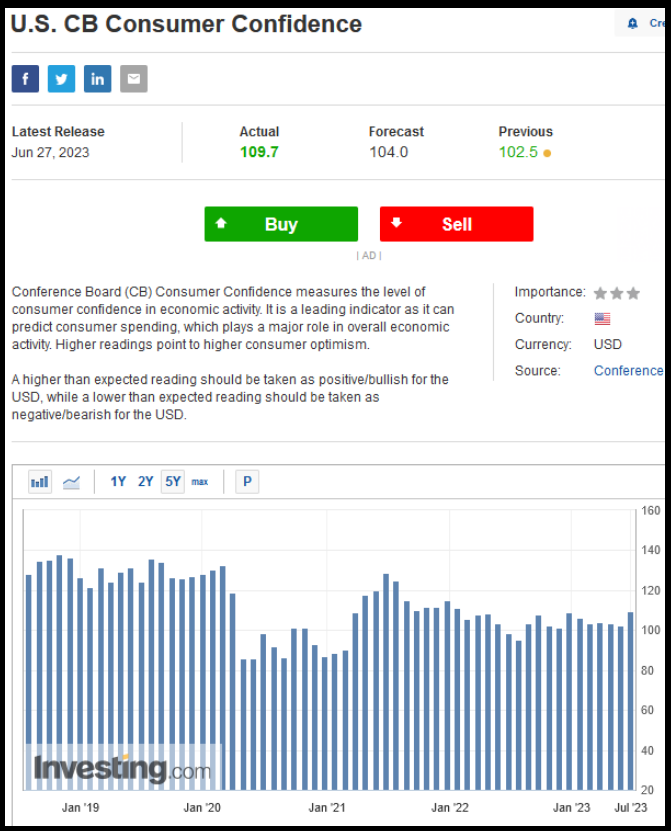
U.S. CB Consumer Confidence

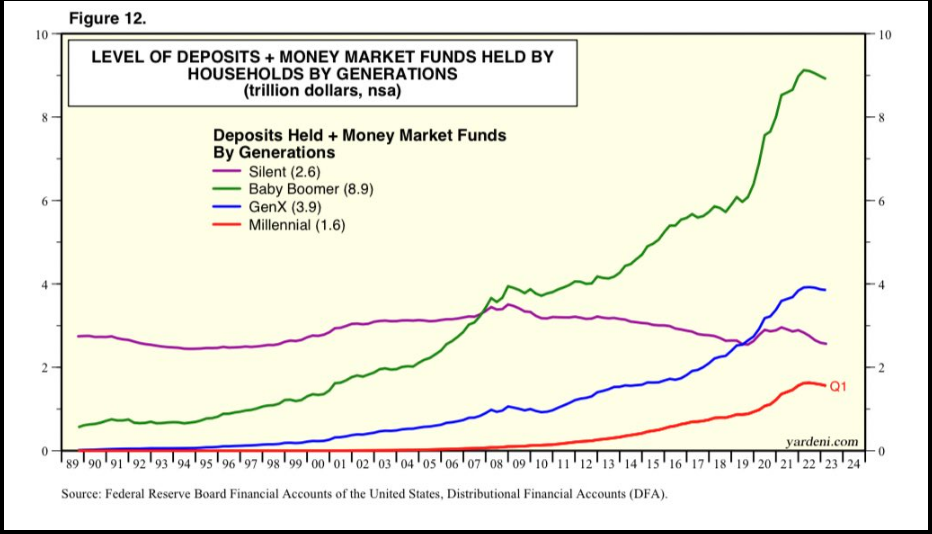
Level of Deposits + Money Market Funds held by households by genera

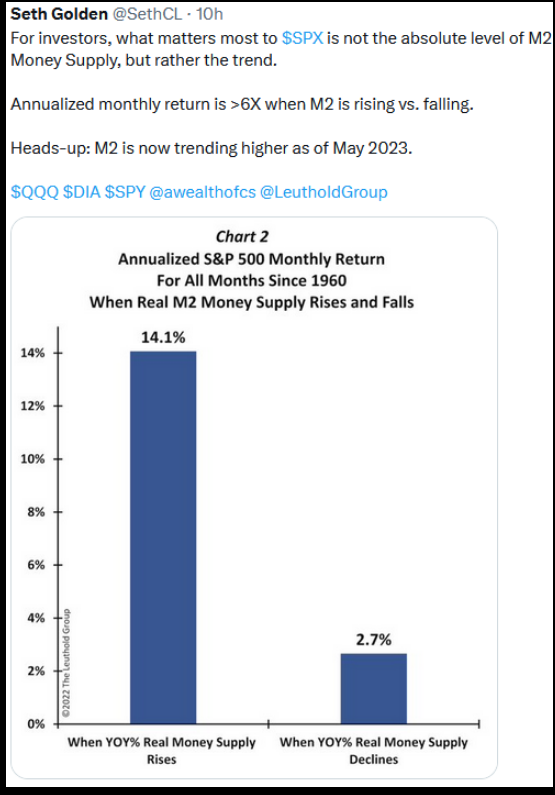
Money Supply

Annualized S&P 500 Monthly Return for AII months Since 1960

FRED

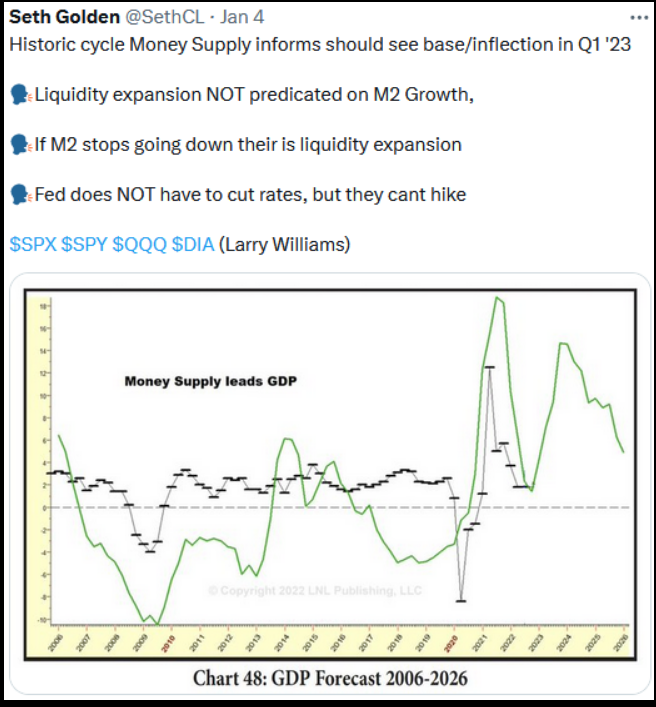
Money Supply leads GDP

Earnings Expectations

Earnings: Set up going into Q2 earnings season the same as going into Q1.

-For Q2, the estimated earnings decline for the S&P 500 is -6.5%

-Q1 had a similar set-up and wound up at -2%.

-Everyone has been calling for a 20% earnings decline since October. Instead, we got a 25% rally in the S&P 500.

-What now? 2024 estimates are going UP in recent weeks to ~$247.
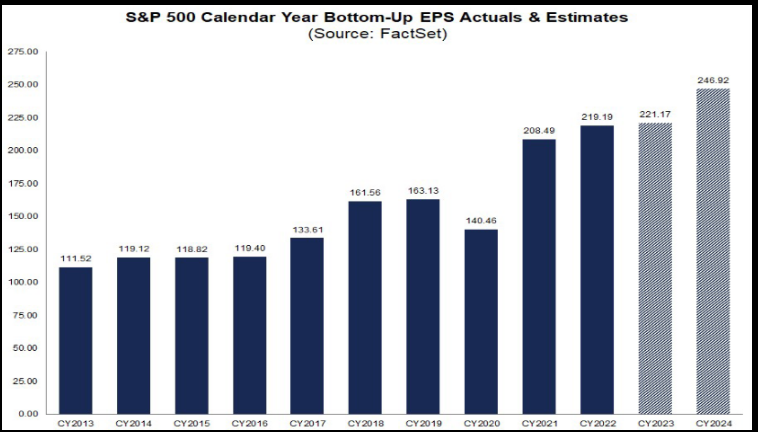
S&P 500 Calendar Year Bottom-Up EPS Actuals & Estimates

Analysts playing “catch up” on buy ratings:
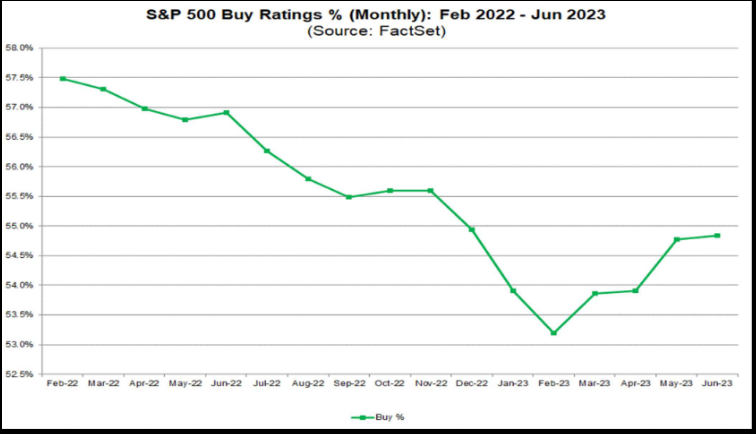
S&P 500 Buy Ratings % (Monthly): Feb 2022 - Jun 2023

Economic Data

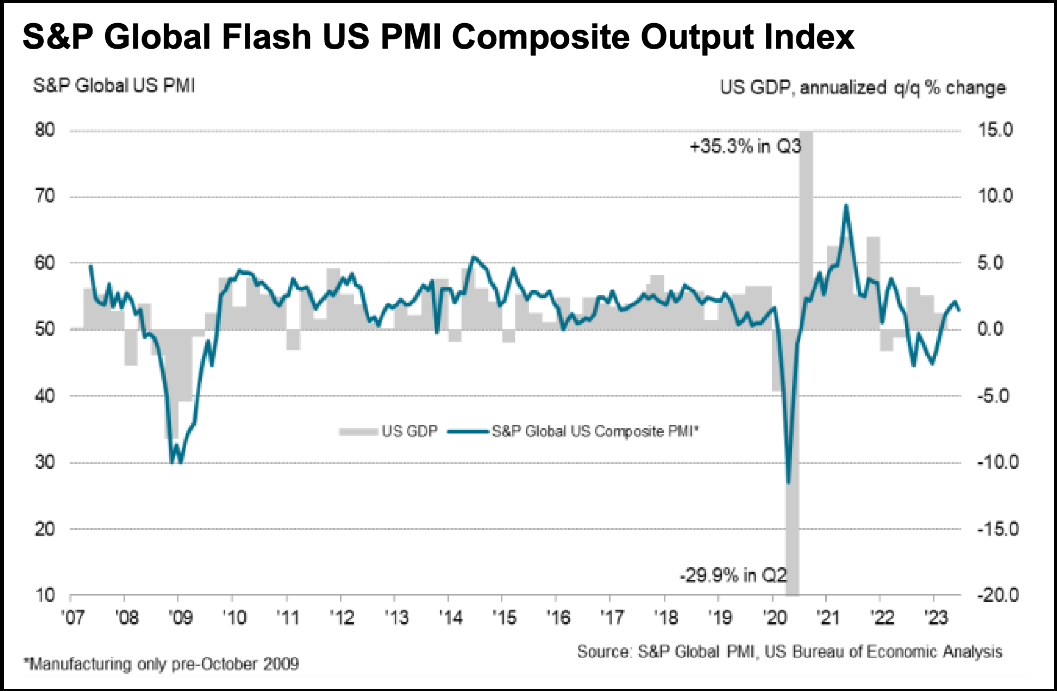
S&P Global Flash US PMI Composite Output Index

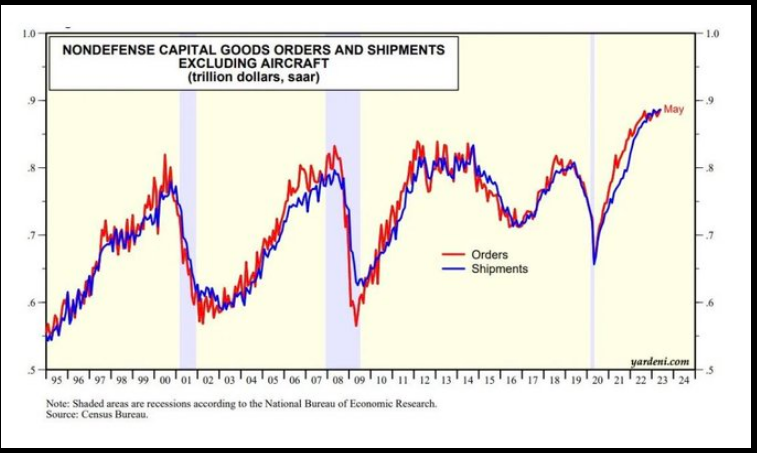
Nondefense Capital Goods Orders and Shipments Excluding Aircraft

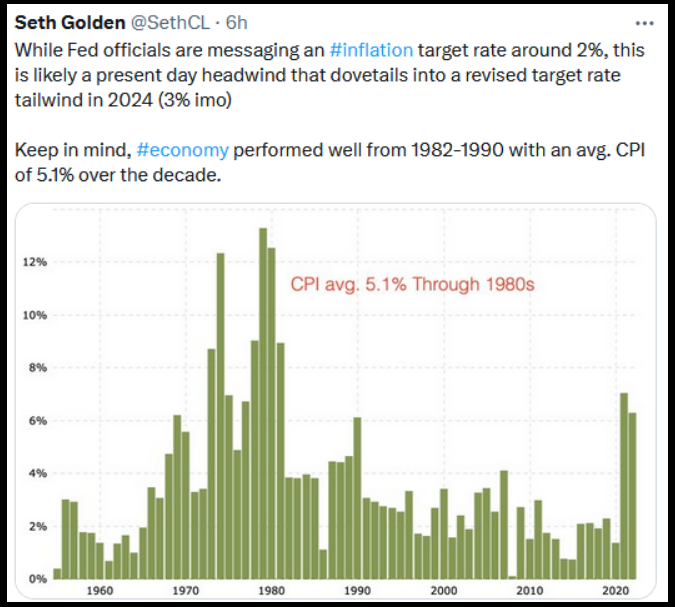
CPI avg. 5.1% Through 1980s

Surprise! You're Not in a Recession

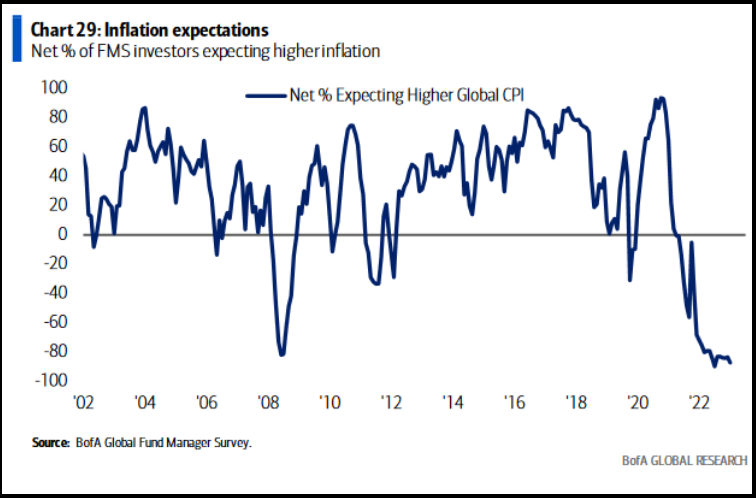
Inflation expectations
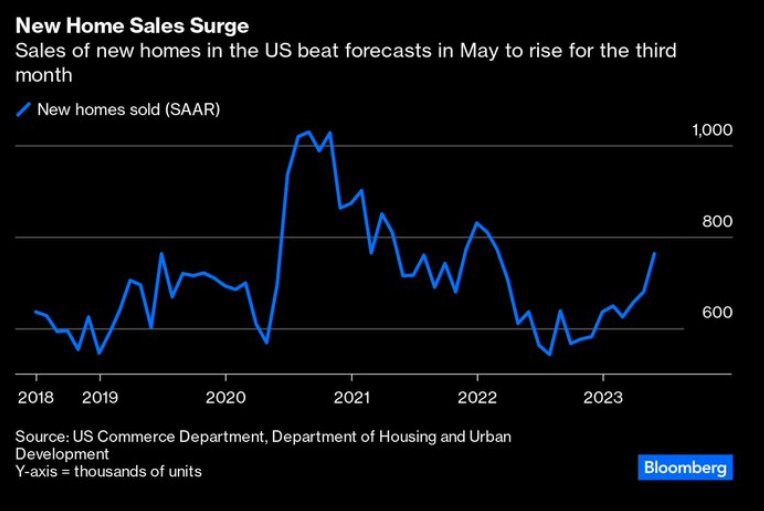
New Homes Sales Surge

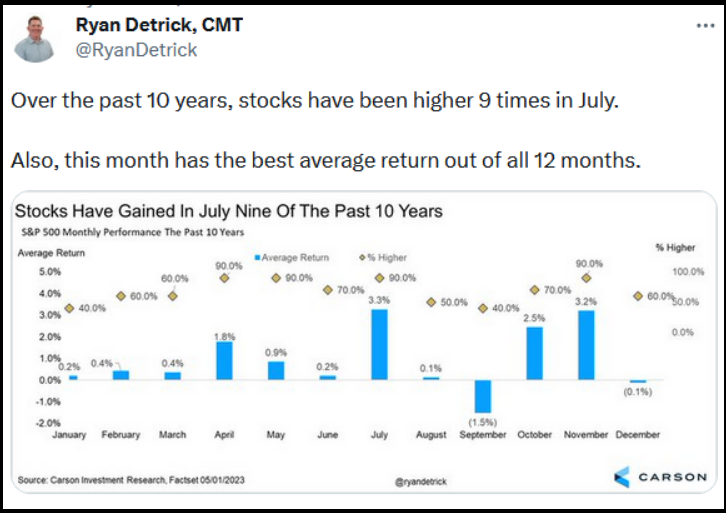
Seasonality

Stocks Have Gained in July Nine of the past 10 Years

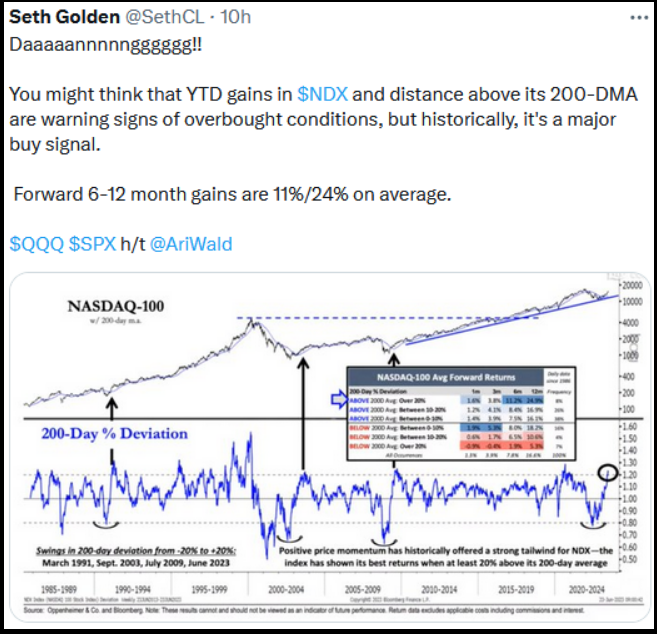
NASDAQ-100

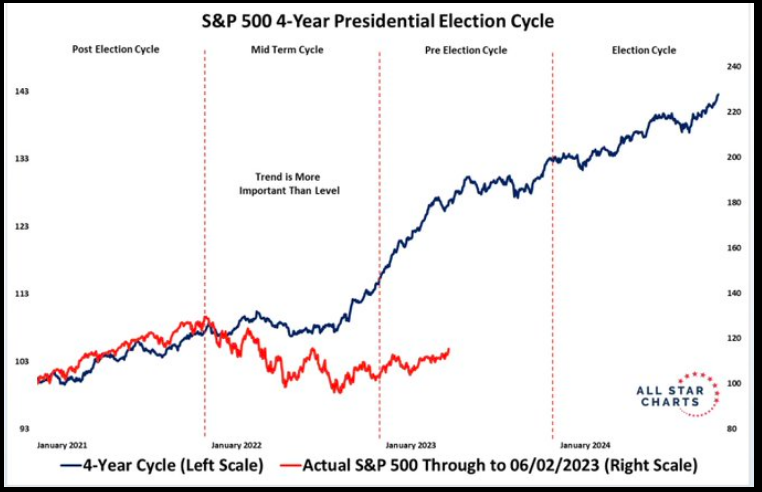
S&P 500 4-year Presidential Election Cycle

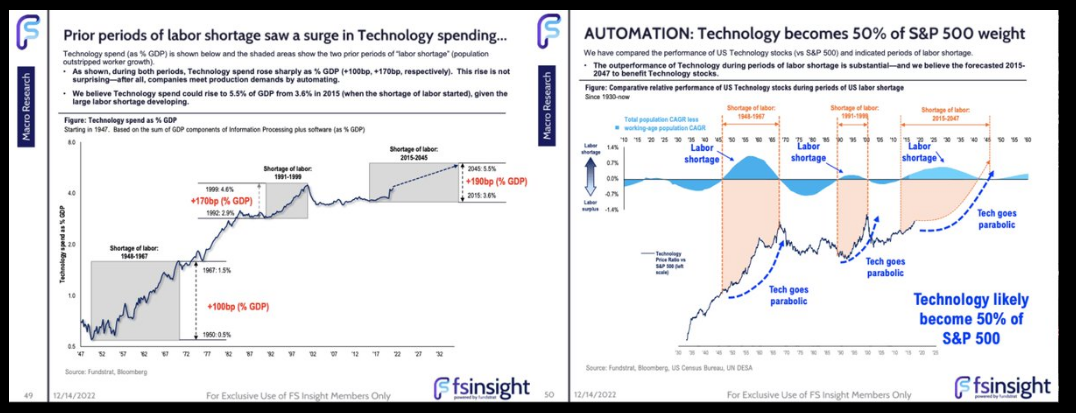
Labor shortage saw a surge in Technology spending...

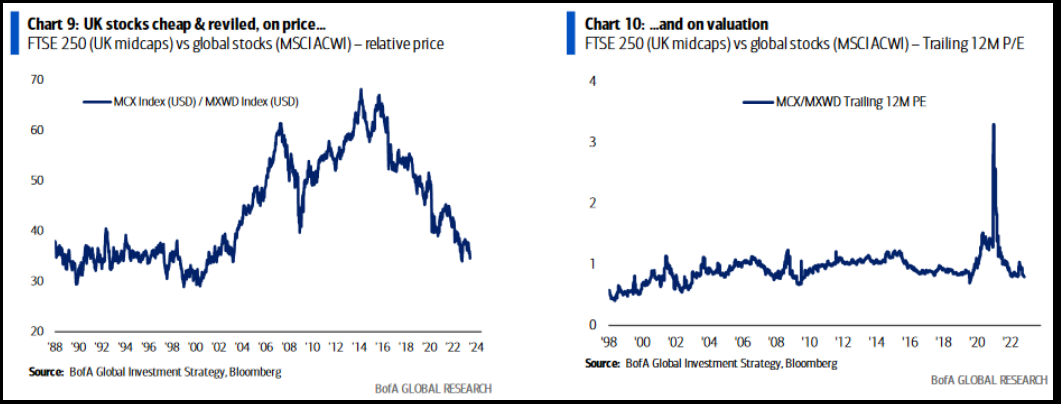
UK

UK Stocks cheap & revlled on price... / ...and on valuation

Banks

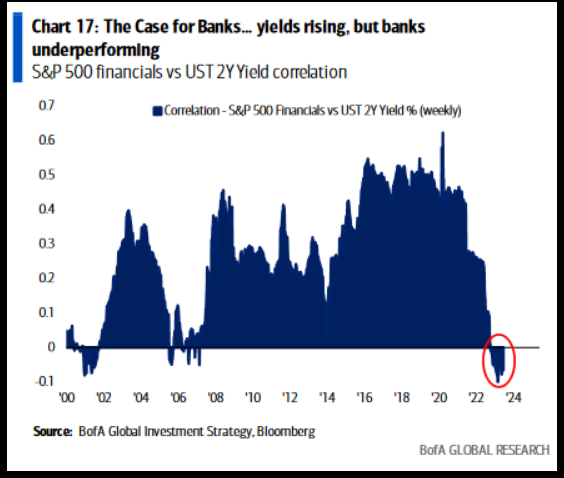
The Case for Banks... yields rising, but banks underperforming

Now onto the shorter term view for the General Market:

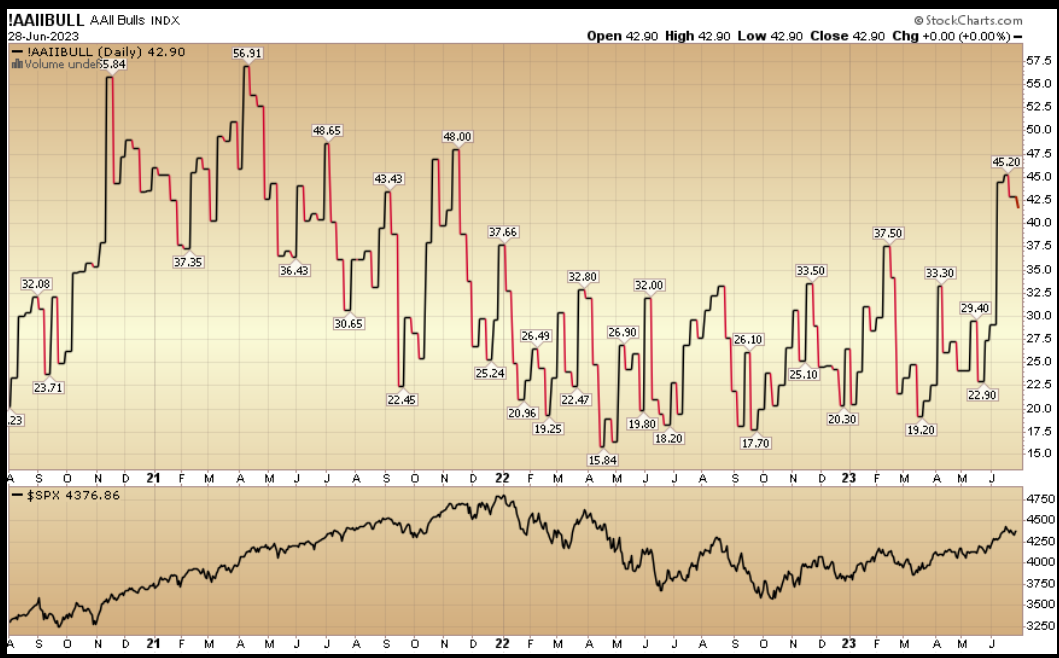
In this week’s AAII Sentiment Survey result, Bullish Percent (Video Explanation) ticked down to 41.9% from 42.9% the previous week. Bearish Percent flat-lined at 27.5% from 27.8%. The retail investor is still optimistic. This can stay elevated for some time based on positioning coming into these levels.
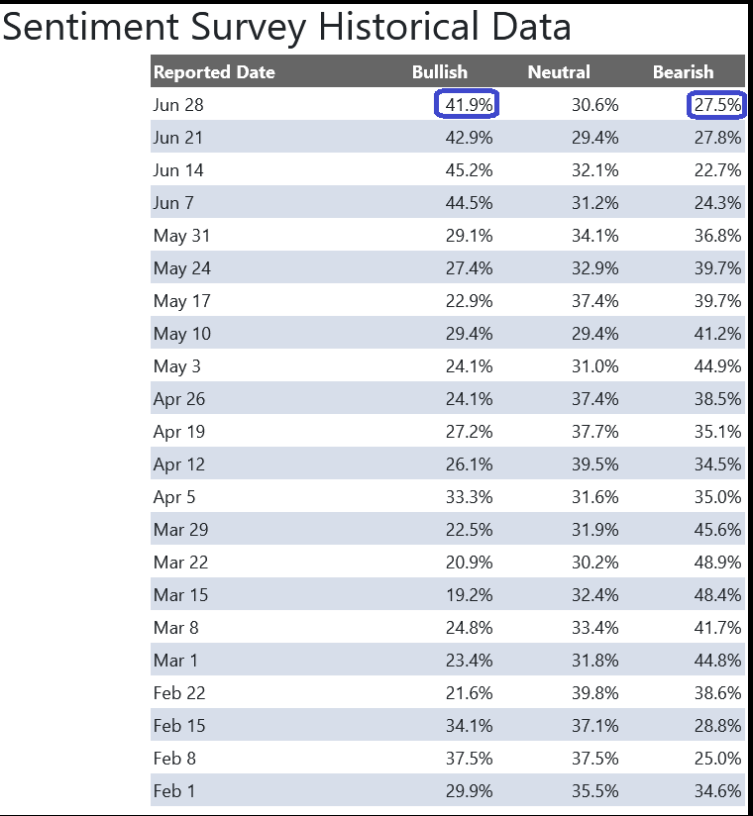
Sentiment Survey Historical Data

AAII Bulls

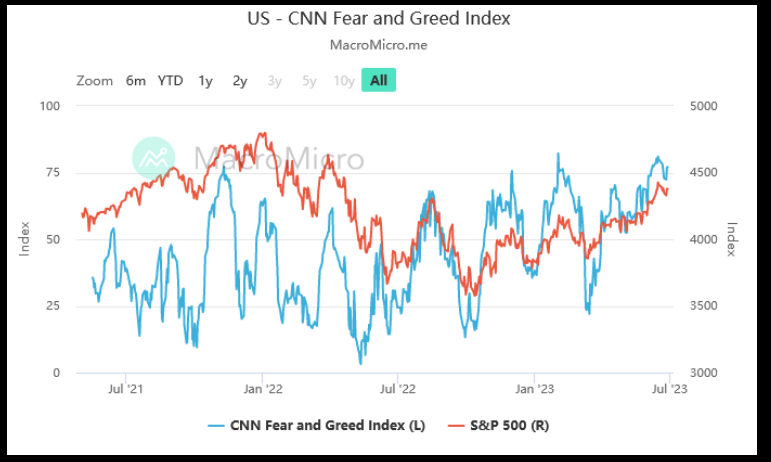
The CNN “Fear and Greed” flat-lined from 79 last week to 79 this week. Sentiment is hot but it would not surprise me if it stays pinned for a bit to force people out of their bunkers and back into the market. You can learn how this indicator is calculated and how it works here: (Video Explanation)
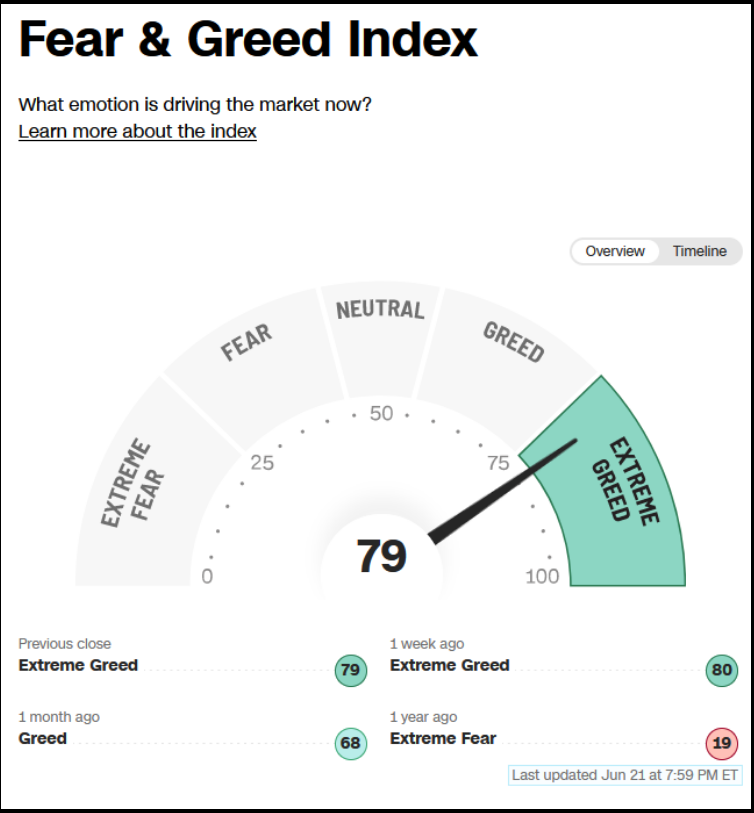
Fear & Greed Index

US - CNN Fear and Greed Index

And finally, the NAAIM (National Association of Active Investment Managers Index) (Video Explanation) ticked up to 83.60% this week from 81.66% equity exposure last week. Managers have been chasing the rally.
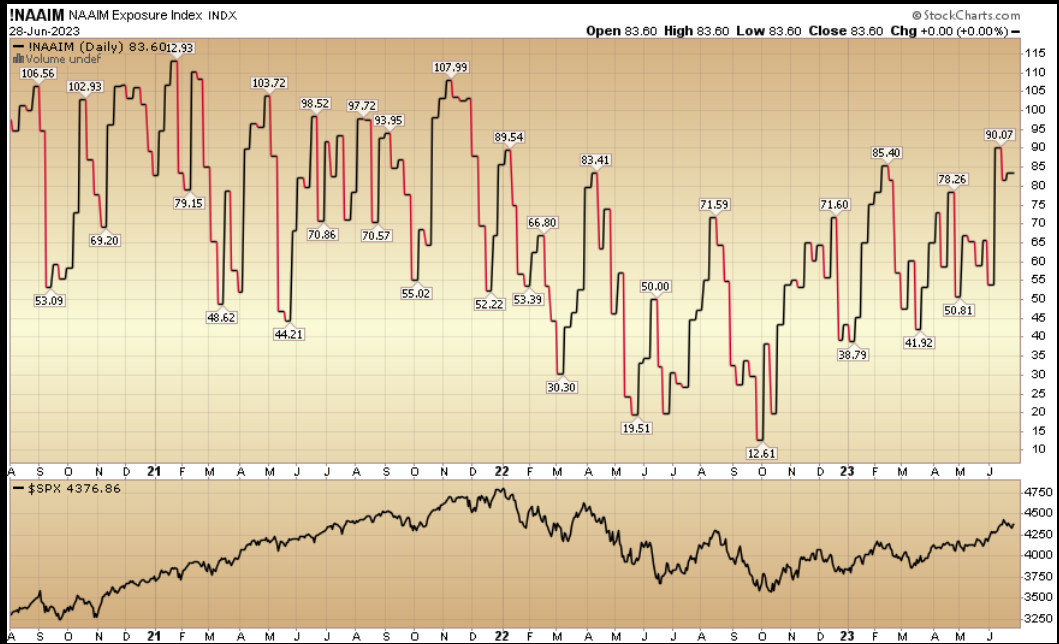
NAAIM Exposure Index

This content was originally published on Hedgefundtips.com

Latest comments

Loading next article…
Risk Disclosure: Trading in financial instruments and/or cryptocurrencies involves high risks including the risk of losing some, or all, of your investment amount, and may not be suitable for all investors. Prices of cryptocurrencies are extremely volatile and may be affected by external factors such as financial, regulatory or political events. Trading on margin increases the financial risks.
Before deciding to trade in financial instrument or cryptocurrencies you should be fully informed of the risks and costs associated with trading the financial markets, carefully consider your investment objectives, level of experience, and risk appetite, and seek professional advice where needed.
Fusion Media would like to remind you that the data contained in this website is not necessarily real-time nor accurate. The data and prices on the website are not necessarily provided by any market or exchange, but may be provided by market makers, and so prices may not be accurate and may differ from the actual price at any given market, meaning prices are indicative and not appropriate for trading purposes. Fusion Media and any provider of the data contained in this website will not accept liability for any loss or damage as a result of your trading, or your reliance on the information contained within this website.
It is prohibited to use, store, reproduce, display, modify, transmit or distribute the data contained in this website without the explicit prior written permission of Fusion Media and/or the data provider. All intellectual property rights are reserved by the providers and/or the exchange providing the data contained in this website.
Fusion Media may be compensated by the advertisers that appear on the website, based on your interaction with the advertisements or advertisers.
© 2007-2024 - Fusion Media Limited. All Rights Reserved.