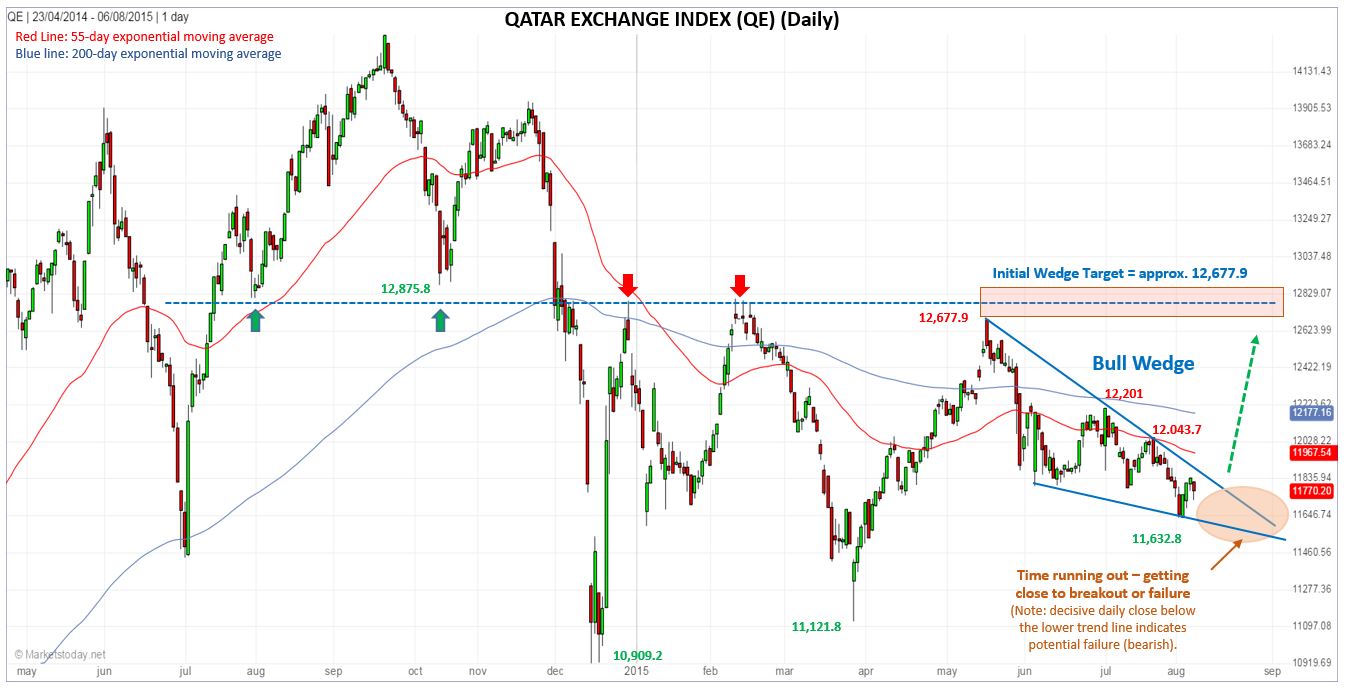
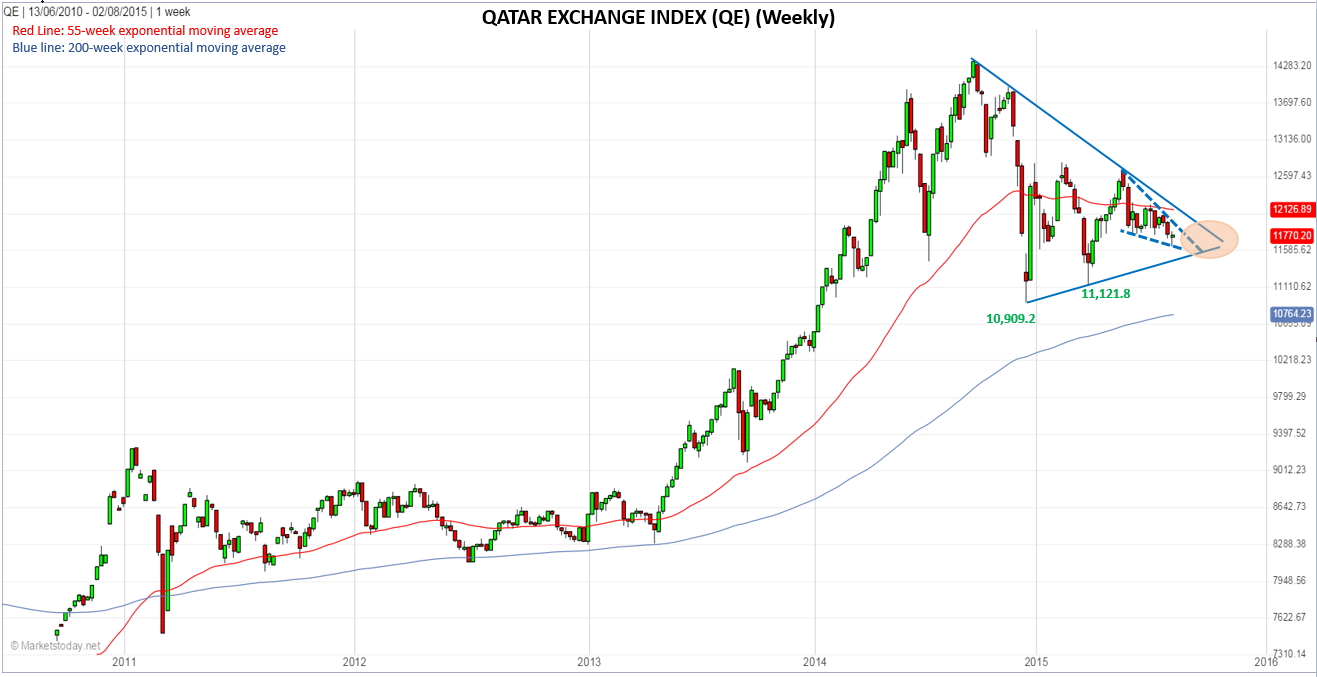
A bullish wedge formation is setting up in the chart of the QE General. Taking into account the pattern to date, a breakout is confirmed on a move above 12,043.7. However, there could be a lower signal develop as the pattern may need a little while longer to progress. At this point an aggressive signal would be given on a move above Wednesday’s high at 11,836.8.

The lower trend line indicates support of the wedge, and therefore a decisive daily close below it will indicate a potential failure of the wedge and increases the possibility for further weakness.

If a clear bullish breakout occurs then look for an initial objective at the beginning of the wedge, which is at 12,677.9. Given previous support and resistance levels, a price zone can also be used from approximately 12,577.9 to 12,875.8.
