Bullish Momentum Revives The Energy Sector’s Price Trend

Published 12/09/2016, 06:30 AM
Updated 07/09/2023, 06:31 AM
SPY
-
XLE
-
XLF
-
XLP
-
XLV
-
XLU
-

It took a year, but the late-2015 recommendations by some analysts for overweighting energy stocks — at a time when the sector’s trend looked rather grim — is now bearing fruit. A year, in other words, can make a big difference in the cyclical fortunes of US equity sectors. Indeed, energy stocks now lead the field for trailing one-year return, based on a set of proxy ETFs.

Energy Select Sector SPDR (NYSE:XLE) is the number-one performing sector at the moment for the past year, courtesy of a 26% total return through yesterday, December 8 (using 252-trading-day accounting). The gain marks a stunning recovery from this time last year, when XLE was in the red by almost 18%.

Meanwhile, the formerly high-flying health care sector has fallen on hard times. The Health Care Select Sector SPDR (NYSE:XLV) is currently the worst performing sector fund. In fact, it’s the only sector with a loss at the moment in the one-year column: XLV is off more than 2% over the past 12 months.

The overall tide, however, is bullish, based on a broad read for US equities. The SPDR S&P 500 ETF (NYSE:SPY) is currently ahead by a solid 12% for the trailing one-year period via 252-trading-day results.
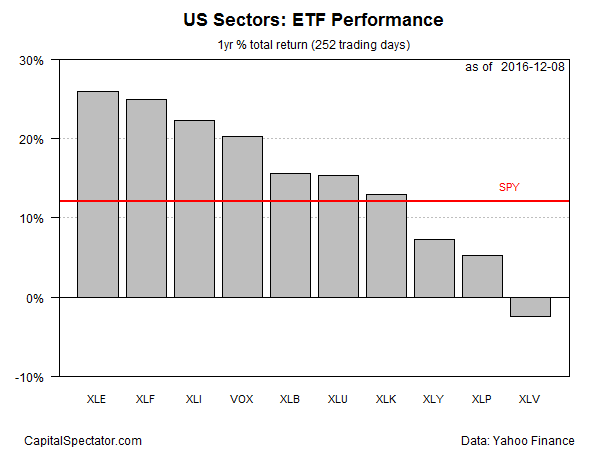
US Sectors: ETF Performance

The next chart offers a visual recap of the current state of sector momentum performances. XLE’s leadership position is conspicuous (black line at top far right), which contrasts sharply with XLV’s downward slide (purple line at bottom).
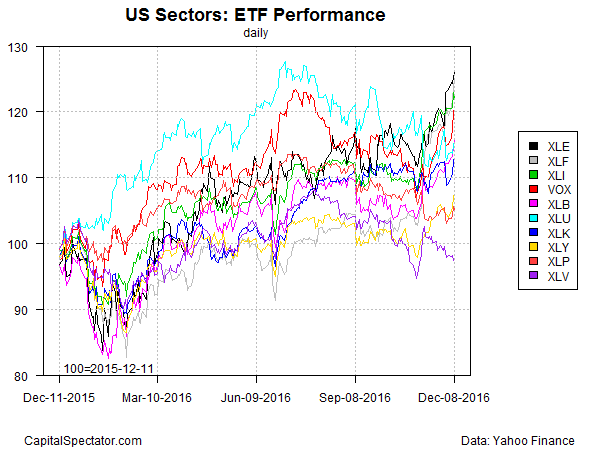
US Sectors: ETF Performance Daily Chart

Looking at sector ETFs via 50- and 200-day moving averages reveals that financial stocks are leading the field. Financial Select Sector SPDR (NYSE:XLF) closed yesterday at more than 14% above its 50-day average and 23%-plus above its 200-day average. XLE’s upside strength ranks second, while utilities (NYSE:XLU), consumer staples (NYSE:XLP), and health care (NYSE:XLV) are suffering negative profiles on this front.
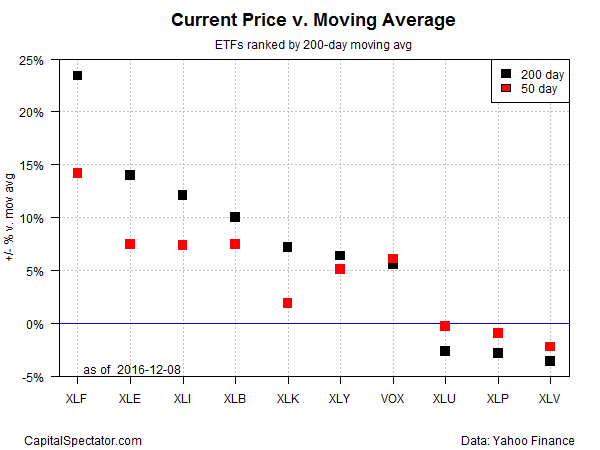
Current Price vs. Morning Average ETFs Chart

Latest comments

Loading next article…
Risk Disclosure: Trading in financial instruments and/or cryptocurrencies involves high risks including the risk of losing some, or all, of your investment amount, and may not be suitable for all investors. Prices of cryptocurrencies are extremely volatile and may be affected by external factors such as financial, regulatory or political events. Trading on margin increases the financial risks.
Before deciding to trade in financial instrument or cryptocurrencies you should be fully informed of the risks and costs associated with trading the financial markets, carefully consider your investment objectives, level of experience, and risk appetite, and seek professional advice where needed.
Fusion Media would like to remind you that the data contained in this website is not necessarily real-time nor accurate. The data and prices on the website are not necessarily provided by any market or exchange, but may be provided by market makers, and so prices may not be accurate and may differ from the actual price at any given market, meaning prices are indicative and not appropriate for trading purposes. Fusion Media and any provider of the data contained in this website will not accept liability for any loss or damage as a result of your trading, or your reliance on the information contained within this website.
It is prohibited to use, store, reproduce, display, modify, transmit or distribute the data contained in this website without the explicit prior written permission of Fusion Media and/or the data provider. All intellectual property rights are reserved by the providers and/or the exchange providing the data contained in this website.
Fusion Media may be compensated by the advertisers that appear on the website, based on your interaction with the advertisements or advertisers.
© 2007-2025 - Fusion Media Limited. All Rights Reserved.