
Telenav (TNAV) caught my eye as it is just the type of stock that I look for. My search all starts with the Zacks Rank, and when I see a stock with the best Zacks Rank I am going to take a deeper look. TNAV has a Zacks Rank #1 (Strong Buy) due to a good earnings history and solid earnings estimate revisions.
Earnings History
Lately, I when I look at an earnings history I key on just the last four quarters. A lot has changed just in this calendar year, so I am putting less and less weight on earnings that are more than a year back.
For TNAV the earnings history over the last four quarters is really looking good. They are four for four in beatint the Zacks Consensus Estimate, which is also a good thing. Drilling deeper I see something that I really like.
Let’s start with the report that came four quarters ago, a 1 cent beat for a 1.6% positive earnings surprise. Then a 4 cent beat for a 6.8% positive earnings surprise. That was followed by an 8 cent beat for a 36% positive earnings surprise and finally the most recent quarter saw a 6 cent beat for a 50% positive earnings surprise.
You can see that the size of positive earnings surprise just keeps getting bigger. At the same time, the loss per share has moved from $0.60 to $0.06. That tells me that profitability is right around the corner.
Estimate Revisions
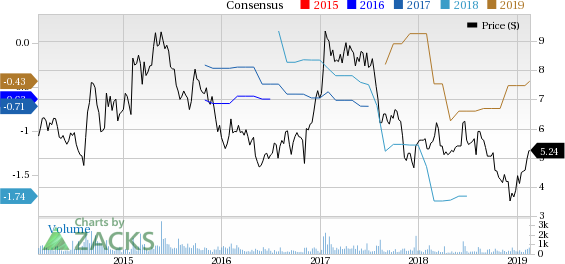
When I see a Zacks Rank #1 (Strong Buy) I am confident that there will be some strong positive moves in the earnings estimates. The Zacks Rank is heavily influenced by recent estimate changes, so let’s look at the number for TNAV.
I see the losses shrinking for this quarter as well as next, each by a penny or two. The real move is the fiscal 2019 number that has moved from a loss of 48 cents to a loss of 43 cents. That is the good news.
There is the fiscal 2020 number that is a bit odd to me. I see that loss increasing… and that isn’t the type of thing we like to see. This could be a case of limited visibility on the part of analysts as we are a good year and a half out from that time frame.
Valuation
We tend to lean on the PE (trailing and forward) but in this instance we will not have that crutch. Instead, we look at price to book to see a great multiple of 2.4x and then another reasonable price to sales multiple of 1.7x. Both of those metrics are good… but then I look at margins.
While there has been some really big, positive move in margins, I see a -48% operating margin and -50% net margin. So it is not a sure thing here at all. Yes, those margin levels were in the -80 range not too long ago, so there is improvement, but still, those large numbers are enough to give me pause.
CHART
Is Your Investment Advisor Fumbling Your Financial Future?
See how you can more effectively safeguard your retirement with a new Special Report, “4 Warning Signs Your Investment Advisor Might Be Sabotaging Your Financial Future.”
Telenav, Inc. (TNAV): Free Stock Analysis Report
Original post
Zacks Investment Research