Every year, investors anxiously await the release of Warren Buffett’s annual letter to see what the “Oracle (NYSE:ORCL) of Omaha” has to say about the markets, economy, and where he is placing his money.
Before we blindly heed Buffett’s advice we must factor in that he has long been a source of contradiction. As Michael Lebowitz previously penned:
“The general platitudes of market and economic optimism Buffett shares in his CNBC interviews, letters to investors and shareholder meetings often run counter to the actions he has taken in his investment approach.
This year was no different as Buffett wrote in his annual letter to Berkshire Hathaway (NYSE:BRKa) shareholders:
“If something close to current rates should prevail over the coming decades and if corporate tax rates also remain near the low level businesses now enjoy, it is almost certain that equities will over time perform far better than long-term, fixed-rate debt instruments. These elements, coupled with the ‘American Tailwind,’ will make ‘equities the much better long-term choice for the individual who does not use borrowed money and who can control his or her emotions.”
To clarify, Buffett is suggesting that over the coming decades, it will be better to be invested in equities (aka S&P 500 Index) versus Treasury bonds, given that the yield on bonds is so low.
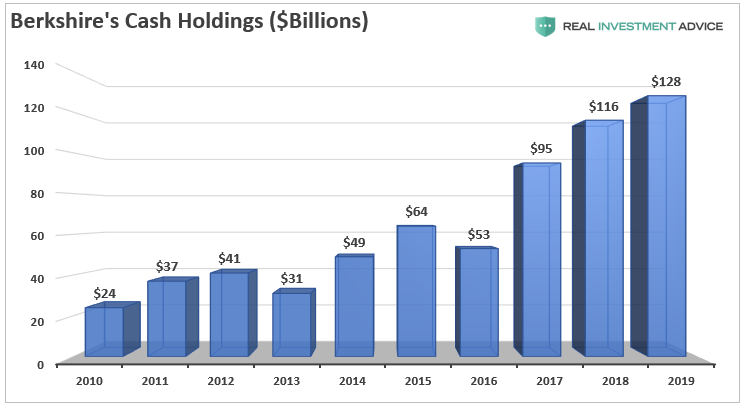
That point doesn’t quite square with facts. Buffett is now holding his largest amount of cash in the history of the firm.
As the old saying goes: “Follow the money.”
If he thinks stocks will outperform bonds why is holding $128 billion in short term bonds?
There is an important distinction to be made if you choose to follow Mr. Buffett’s advice. It is true that stocks will outperform bonds over the long-term given the right starting valuations and a long enough time frame. Currently, using Warren Buffett’s favorite measure of valuations (Market Capitalization to GDP), there is a substantial risk of low returns from stocks over the next decade.
While valuations DO NOT predict market crashes, they are very predictive of future returns on investments from current levels.
Period.
I previously quoted Cliff Asness on this issue in particular:
“Ten-year forward average returns fall nearly monotonically as starting Shiller P/E’s increase. Also, as starting Shiller P/E’s go up, worst cases get worse and best cases get weaker.
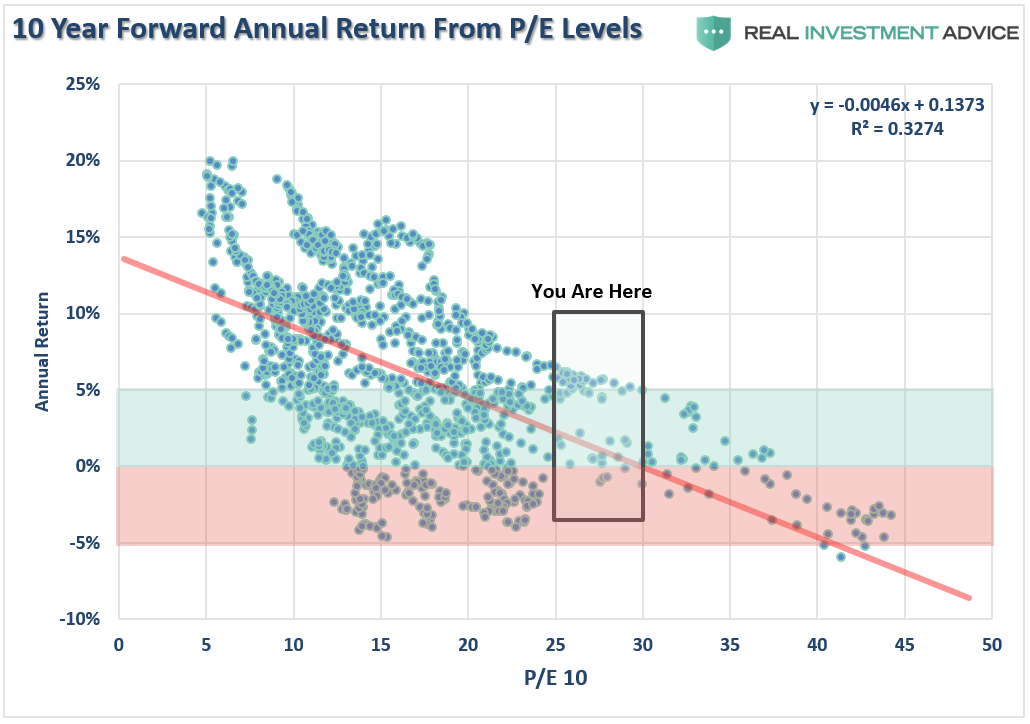
If today’s Shiller P/E is 30x, and your long-term plan calls for a 10% nominal return on the stock market, you are assuming a best case scenario to play out in a market that is drastically above the average case from these valuations. We can prove that by looking at forward 10-year total returns versus various levels of PE ratios historically.
Importantly, this is likely the reason that Buffett is sitting on $128 billion in historically low yielding bonds. The graph below provides further evidence using his favorite valuation indicator, market cap to GDP.
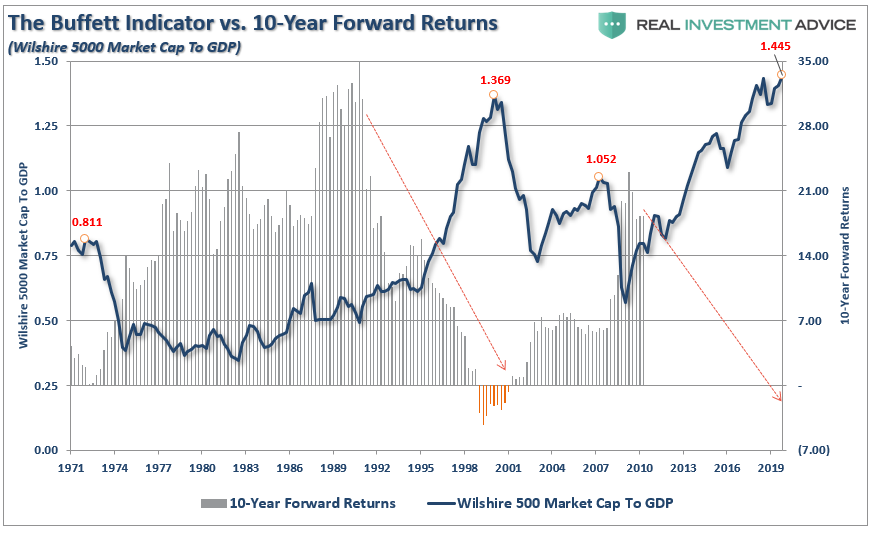
Not surprisingly, like every other measure of valuation, forward return expectations are substantially lower over the next 10-years as opposed to the past 10-years.
“Price is what you pay, value is what you get.” – Warren Buffett
Do What I Say, Not What I Do
So the question is this:
“If Warren is suggesting you should just invest in the index and hold on, why is he sitting on so much cash?”
The immediate observation is that he is just waiting on a “good deal” to come along. He has been vocal about looking for a new acquisition. However, he hasn’t done so. Why, “valuations” are sky high.
Unfortunately, “good deals” based on valuations, and market crashes, have typically been highly correlated throughout history. As he said in his letter:
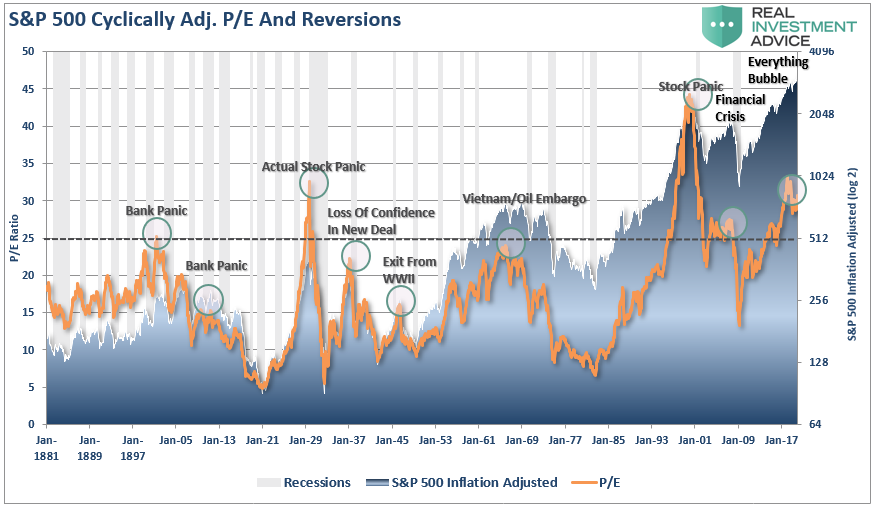
“Anything can happen to stock prices tomorrow. Occasionally, there will be major drops in the market, perhaps of 50% magnitude or even greater.”
Interestingly, while Buffett has been telling everyone else to buy a stock index, and avoid bonds, he has been doing exactly the opposite by “buying bonds.”
Make no mistake, Buffett is indeed a great investor, and has made a tremendous amount of money for his shareholders over the years. One of the reasons for this is that at times of market excesses he has preferred holding cash.At the time he is leaving money on the table, but that cash can be deployed when markets are panicking and value appears. Remember, Buffett had cash on hand in 2008 to lend to Goldman Sachs (NYSE:GS) at 10%.
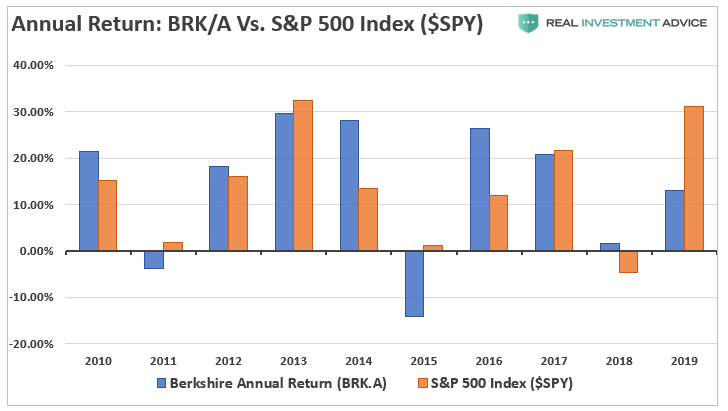
The downside to holding cash is that performance of Berkshire Hathaway (NYSE:BRKa) is no longer outperforming the S&P in recent years. This is due to the shear “size” of the company as Buffett no longer has the luxury of making small value-based acquisitions of a few hundred million in value. Such acquisitions don’t “move the needle” in terms of returns for shareholders. Berkshire has grown to the point it has essentially become an index itself.
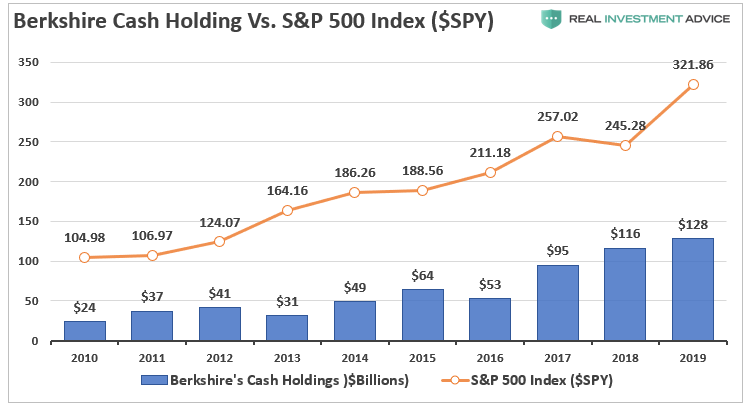
The chart below shows Buffett’s annual cash holdings versus the S&P 500 ($SPY) over the last several years.
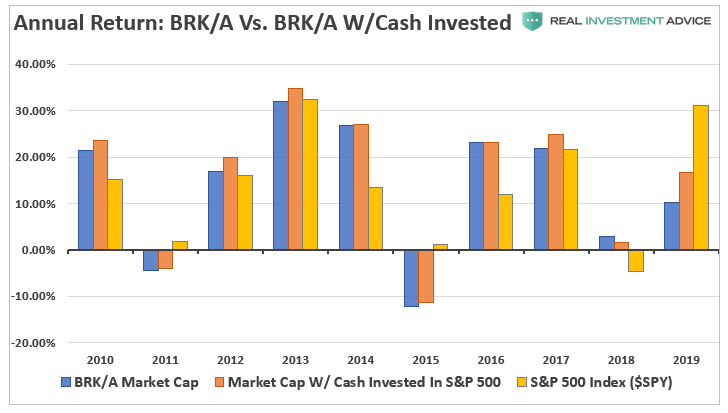
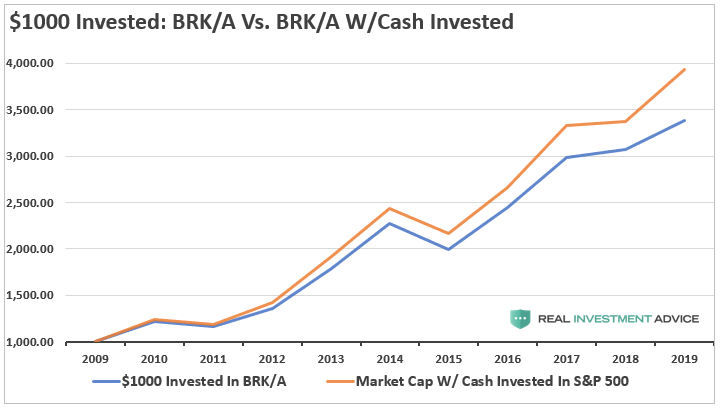
So, what would have happened if Buffett had taken his own advice and invested his cash into the S&P 500 index rather than bonds. The index is highly liquid, so he could have sold the index at any time he needed cash for an acquisition, and the shares could have been lent out for an additional return on his investment.
However, the chart below shows the difference in market cap of the Berkshire Hathaway (NYSE:BRKa) currently, with the cash invested in the S&P 500 index, as compared to the returns of the S&P 500 index. Not surprisingly, returns to shareholders improved over the last decade.
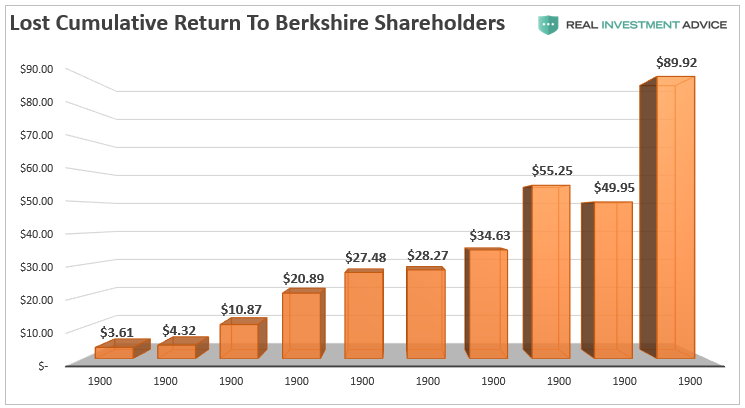
While it may not look like much on a percentage basis, the cumulative return lost to Berkshire Shareholders over the last decade was roughly $90 Billion dollars.
Or rather, a $1000 investment in 2010 would have grown to nearly $4000 versus just $3500.
Summary
As Michael Lebowitz previously wrote:
“Warren Buffett is without question the modern day icon of American investors. He has become a living legend, and the respect he receives is warranted. He has certainly been a remarkable steward of wealth for himself and his clients.
Where we are challenged with regard to his approach, is the way in which he shirks his responsibilities as a leader. To our knowledge, he is not being overtly dishonest but he certainly has a way of rationalizing what appears to be obvious contradictions. Because of his global following and the weight given to each word he utters, the fact that his actions often do not match the spirit of his words is troubling.”
Warren Buffett did not amass his fortune by following the herd but by leading it.
He is sitting on a $128 Billion in cash for a reason. Buffett is fully aware of the gains he has forgone, yet still continues his ways. Buffet is not dumb!
Before taking his advice to buy an index and hold on, you may want to consider more carefully why he is telling you to “do as I say, not as I do.”
