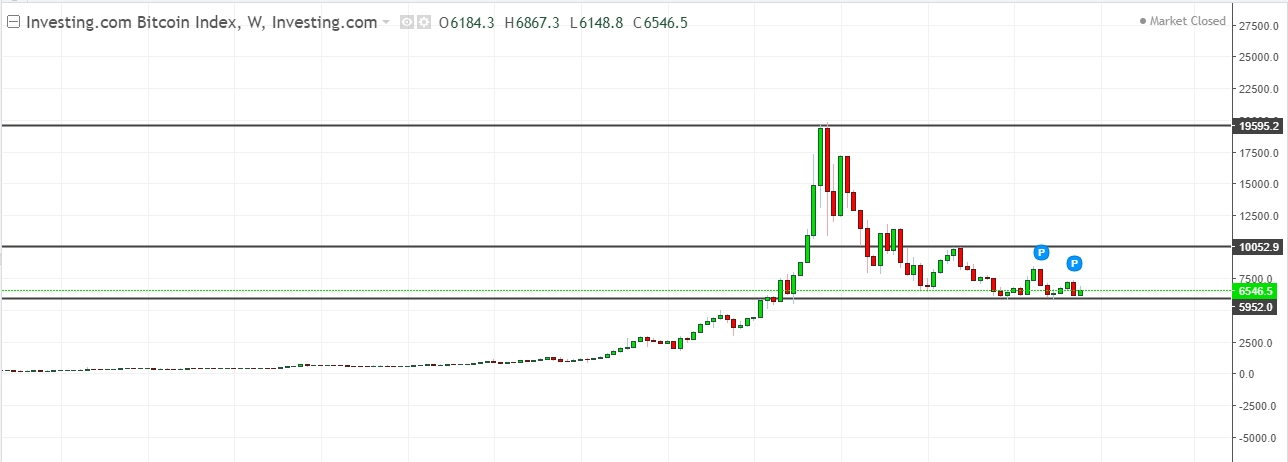
There has been a decent drop in the BTC/USD pair after it hit the record high near 19595.20. From that level, the sellers took control of this market and pushed the pair significantly lower in the global market. The pair found some solid support at 6425.2 and most of the professional price action traders made a decent profit by executing long orders with the formation of bullish morning star pattern in the daily chart. Though the bulls initially took control of this market the pair found some strong bearish resistance at 10052.9.
BTC/USD technical chart analysis
Figure: BTC/USD testing major support level in the weekly chart
In the above figure, you can clearly see the bulls are trying to take control of this market but the formations of new lower highs suggest the current bearish momentum in the market. Though the price tested support zone of the triangle pattern formed in the weekly chart several times, the professional experts in the crypto trading industry are expecting a strong recovery attempt from this level. However, a clear break of the price below the current support level at 5952.0 will result in a sharp fall in the BTC/USD pair.
On the upside, the pair needs to break above the minor resistance level at 8081.3 to refuel to BTC/USD bulls. The long-term conservative traders will be waiting for a weekly closing of the price above the major resistance level at 10052.9 to enter fresh long. However, the aggressive traders have already gone long in the BTC/USD pair with a tight stop loss just below the current support level.
Though the recent performance of the U.S economy is not up to the mark the possibility of a rate hike from the FED officials near the end of the month is pushing the most of the major rivals of U.S dollar lower. But the recent gain in the U.S dollar index might be short-lived as no clear policy is stated out to adjust the inflation rate problem. So buying the BTC/USD pair near a solid support zone might offer excellent profit taking the opportunity to the long-term investors.

