BTC/USD Technical Analysis: Daily Ichimoku Acting As Resistance

Published 02/25/2018, 11:32 PM
Updated 11/07/2024, 03:12 PM

BTC/USD Technical Analysis: Today I’d like to take a look at Bitcoin’s price action and conduct an Ichimoku-based technical analysis on the daily chart. What needs to be done for Bitcoin to revive its bullish momentum back to all-time highs?

BTCUSD Technical Analysis

After reaching the all-time high levels close to $20,000 in December 2017, BTC saw sharp pullbacks all the way down to the 78% Fibonacci retracement level by February 2018. $5,970 provided hard support on February 6th. BTC/USD then spent the rest of February erasing losses.

That is until it hit the daily Ichimoku cloud which has been acting as a resistance. Not only that, another resistance that prevented the bullish sentiment to continue, was the strongest Fibonacci level of them all, the 50%.

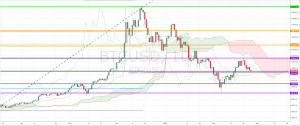
At around $11,544, BTC/USD formed an evening star candlestick chart pattern.The good news is, the Tenkan line has crossed above the Kijun line on Ichimoku Kinko Hyo's daily setup. BTC is currently supported by the 61% Fibonacci at $9,570. So all it needs is a renewed bullish momentum to help it cross over the Ichimoku cloud. So far at the time of filming early during Monday’s Asian trading session, the sentiment seems indecisive. We can see a Spinning Top candlestick right above the key Fibonacci support.

Bitcoin market cap currently stands a little above $164 billion.

In the international fundamental news, we've learned that one of Northern Ireland’s biggest residential property developers, will now be accepting Bitcoin as a payment method. This is reportedly the first house-building firm in the Republic of Ireland to accept BTC payments. They do recognize the challenges in accepting Bitcoin as payment. But are ready to take a chance.

So it looks like if we get the price action back in the right momentum, the fundamentals could support a higher Bitcoin price.

Latest comments

Loading next article…
Risk Disclosure: Trading in financial instruments and/or cryptocurrencies involves high risks including the risk of losing some, or all, of your investment amount, and may not be suitable for all investors. Prices of cryptocurrencies are extremely volatile and may be affected by external factors such as financial, regulatory or political events. Trading on margin increases the financial risks.
Before deciding to trade in financial instrument or cryptocurrencies you should be fully informed of the risks and costs associated with trading the financial markets, carefully consider your investment objectives, level of experience, and risk appetite, and seek professional advice where needed.
Fusion Media would like to remind you that the data contained in this website is not necessarily real-time nor accurate. The data and prices on the website are not necessarily provided by any market or exchange, but may be provided by market makers, and so prices may not be accurate and may differ from the actual price at any given market, meaning prices are indicative and not appropriate for trading purposes. Fusion Media and any provider of the data contained in this website will not accept liability for any loss or damage as a result of your trading, or your reliance on the information contained within this website.
It is prohibited to use, store, reproduce, display, modify, transmit or distribute the data contained in this website without the explicit prior written permission of Fusion Media and/or the data provider. All intellectual property rights are reserved by the providers and/or the exchange providing the data contained in this website.
Fusion Media may be compensated by the advertisers that appear on the website, based on your interaction with the advertisements or advertisers.
© 2007-2025 - Fusion Media Limited. All Rights Reserved.