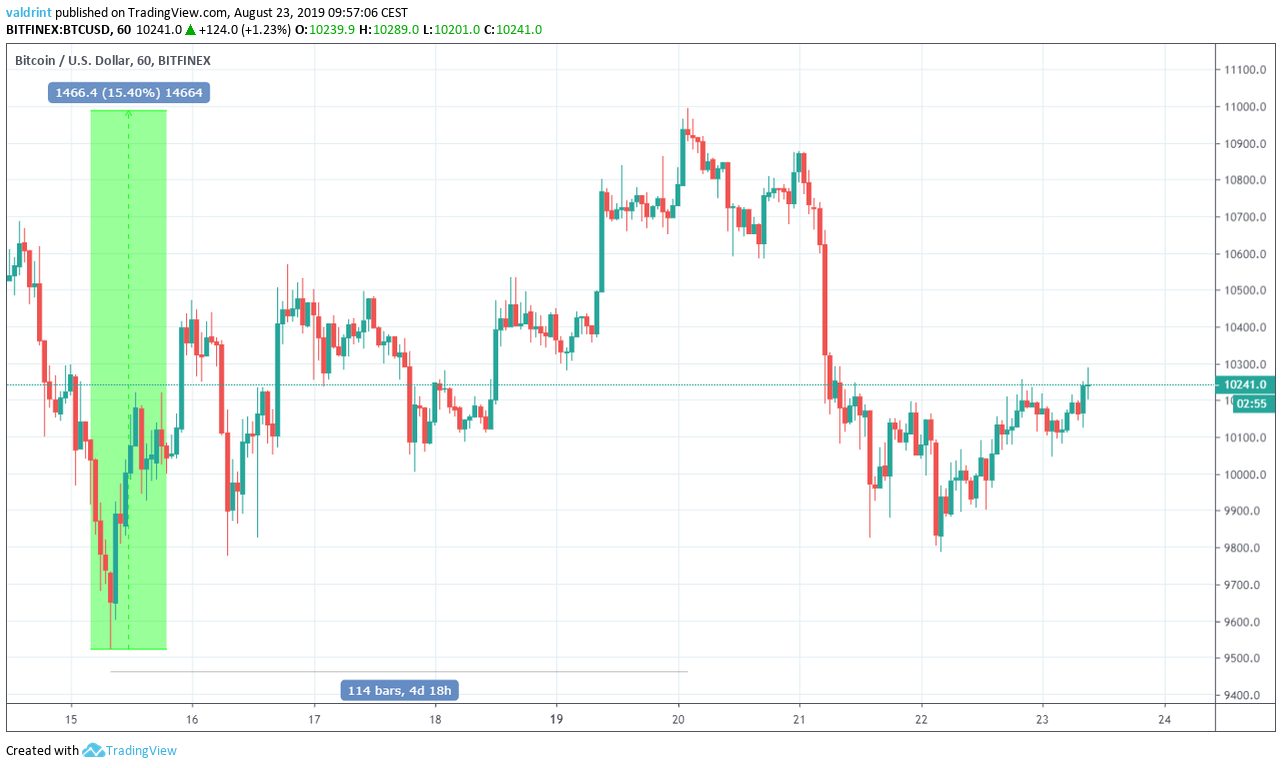
On Aug. 15, the Bitcoin price made a low of $9522. A gradual upward move followed. On Aug.20, the price reached a high of $10,993. This is an increase of 15.5 percent over nearly five days. The price has been decreasing since.
Will the BTC price initiate a reversal or will it continue to decrease? Continue reading if you want to find out.
Bitcoin Price: Trends and Highlights for August 23
Trading Patterns for the BTC Price
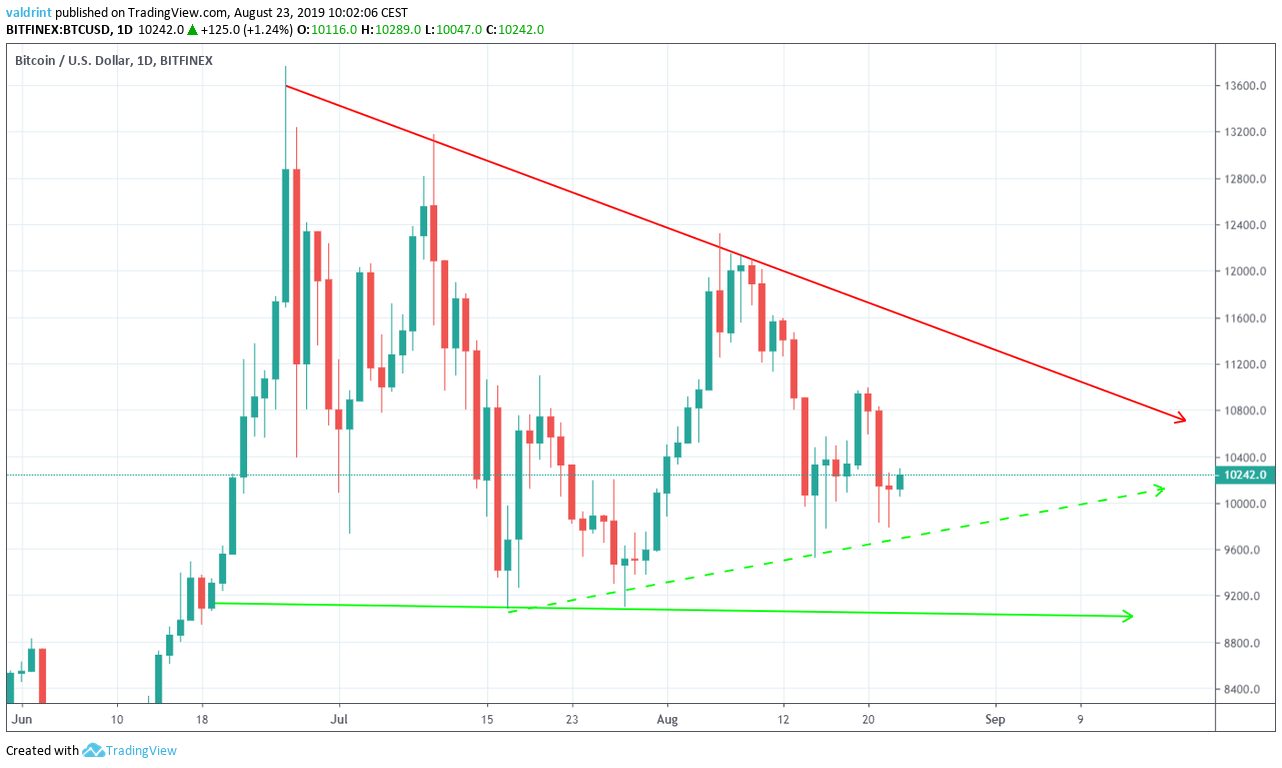
A look at the daily time-frame shows that the BTC price is trading inside one of two patterns — a symmetrical or a descending triangle.
The resistance line has been validated several times.
However, there are two possible supporting lines that the price is following.
While it originally followed the horizontal support line, it has made several higher lows since July 15 — creating the ascending support.
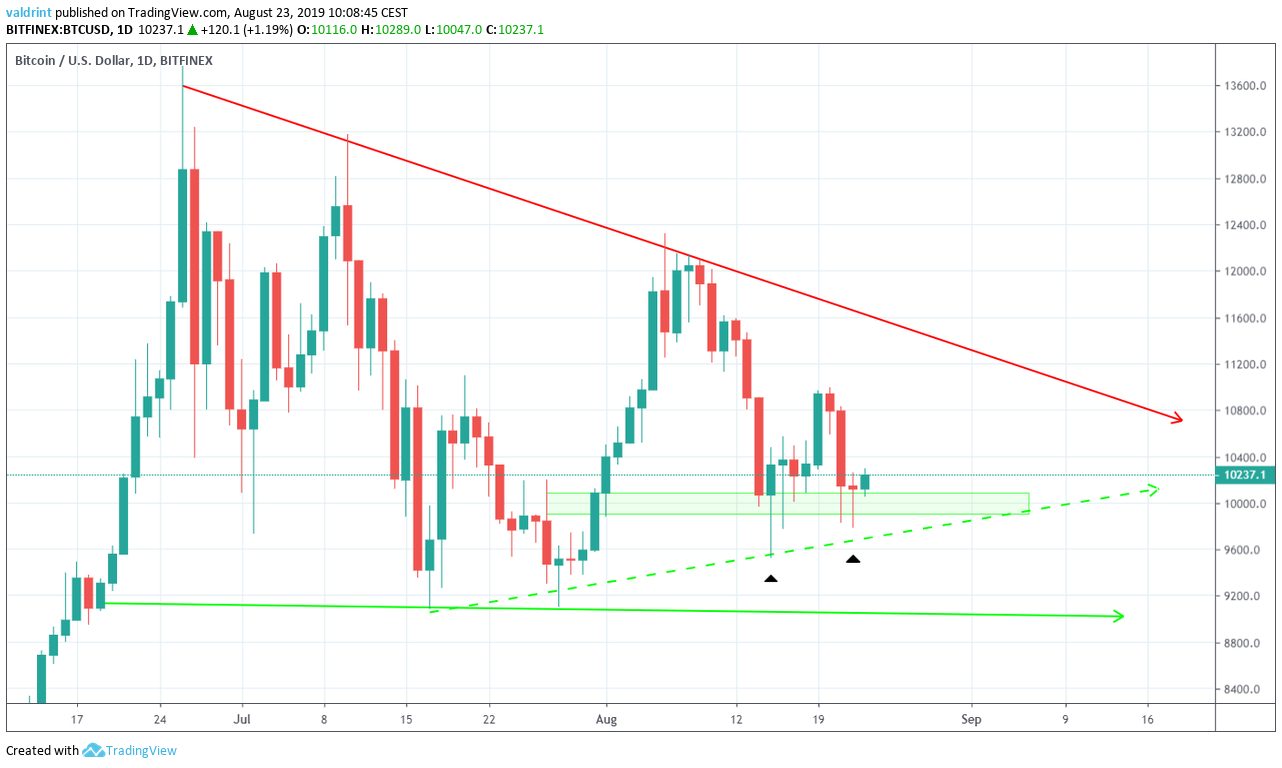
Additionally, there is one support area at $10,000 — identified by the long lower wicks of Aug. 14 and 20.
This makes us believe that both patterns could be valid.
It is possible that the Bitcoin price increases inside the confines of the symmetrical triangle.
If a breakdown occurs, the next level of support would be provided by the horizontal support line.
The resistance line is the same for both patterns.
In order to decide what will happen, we will take a look at a longer-term pattern.
Technical Indicators
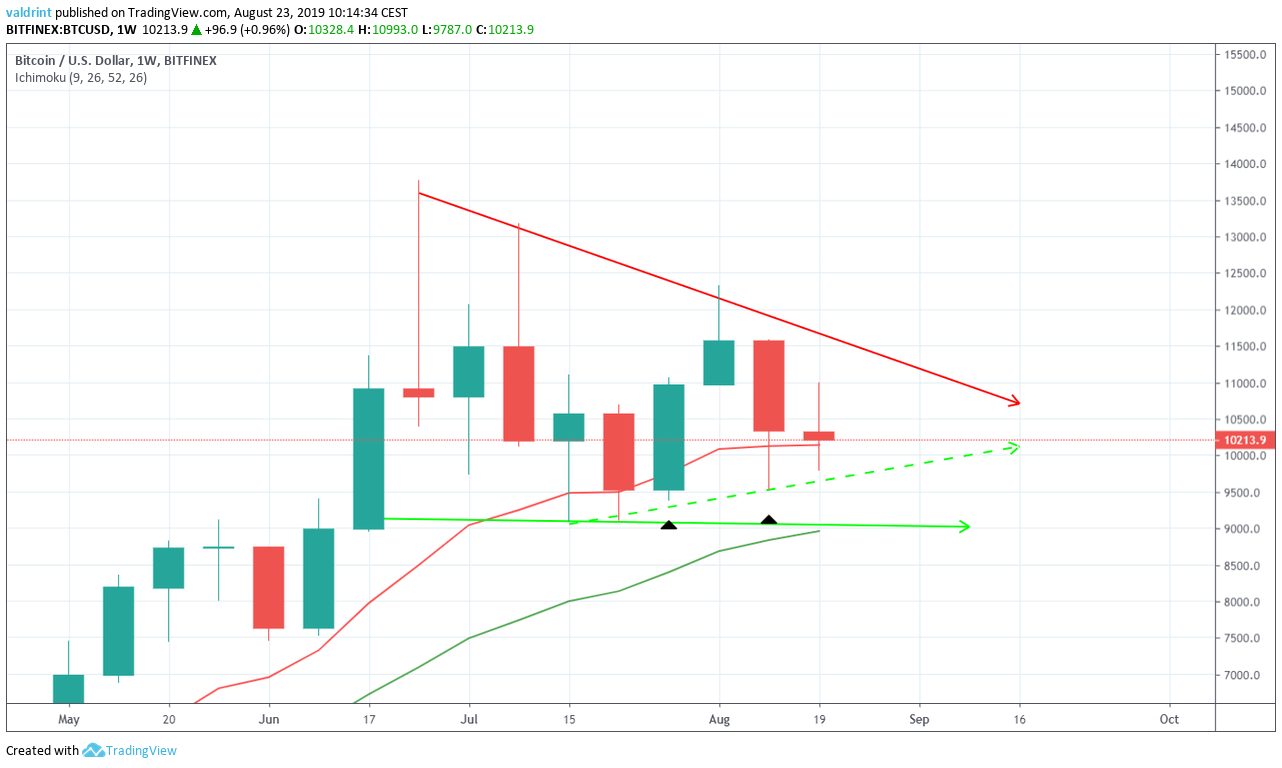
A look at the weekly moving averages (MA) gives extra significance to both support lines.
The 10-week MA is coinciding with the ascending support line, while the 20-week one coincides with the horizontal support line.
Additionally, we can see that the BTC price has not yet reached a close below the 10-week MA.
This gives credence to the ascending support line, since a close below the 10-week MA would likely cause a breakdown.
However, a look at the RSI suggests that a breakdown is likely.
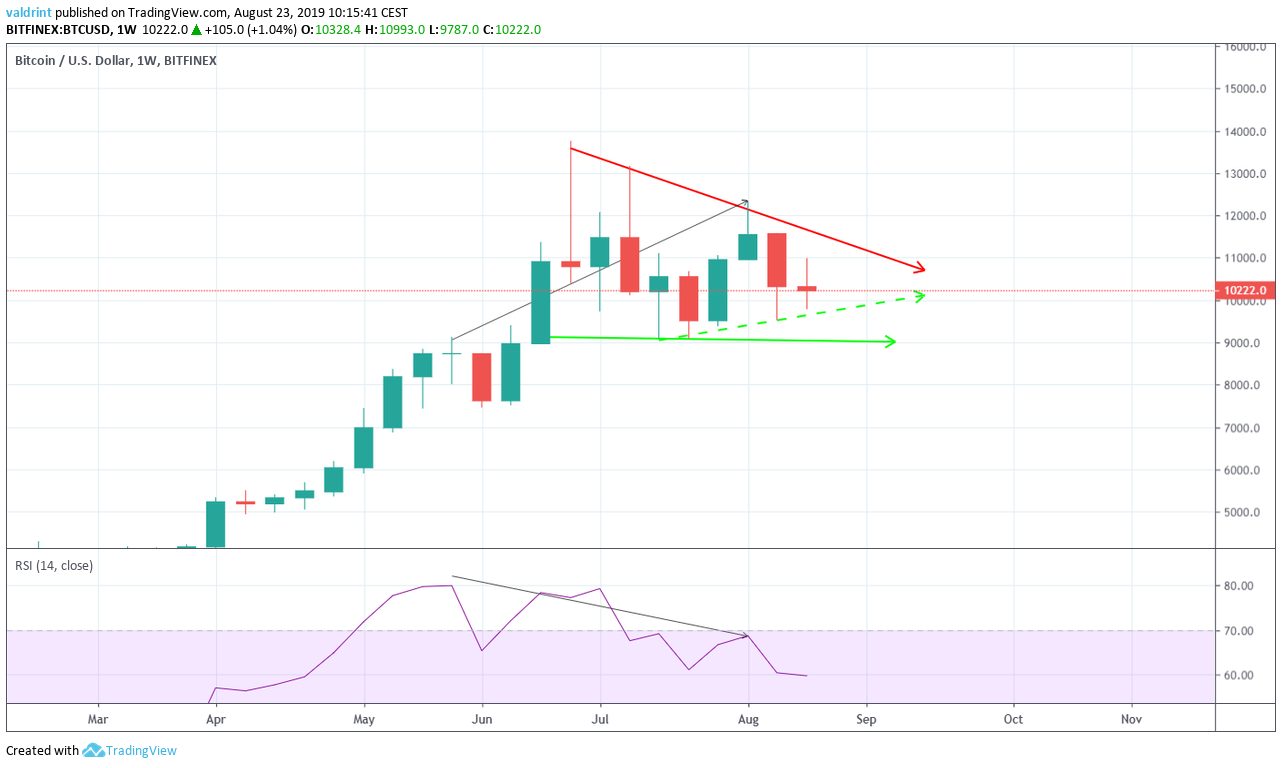
It has been generating very significant bearish divergence since the beginning of May.
Only a small downward move has occurred as a result of the divergence.
Therefore, we believe that the BTC price is likely to eventually break down from the symmetrical triangle and reach the horizontal support line.
Additionally, this view is supported by an analysis of weekly candlesticks.
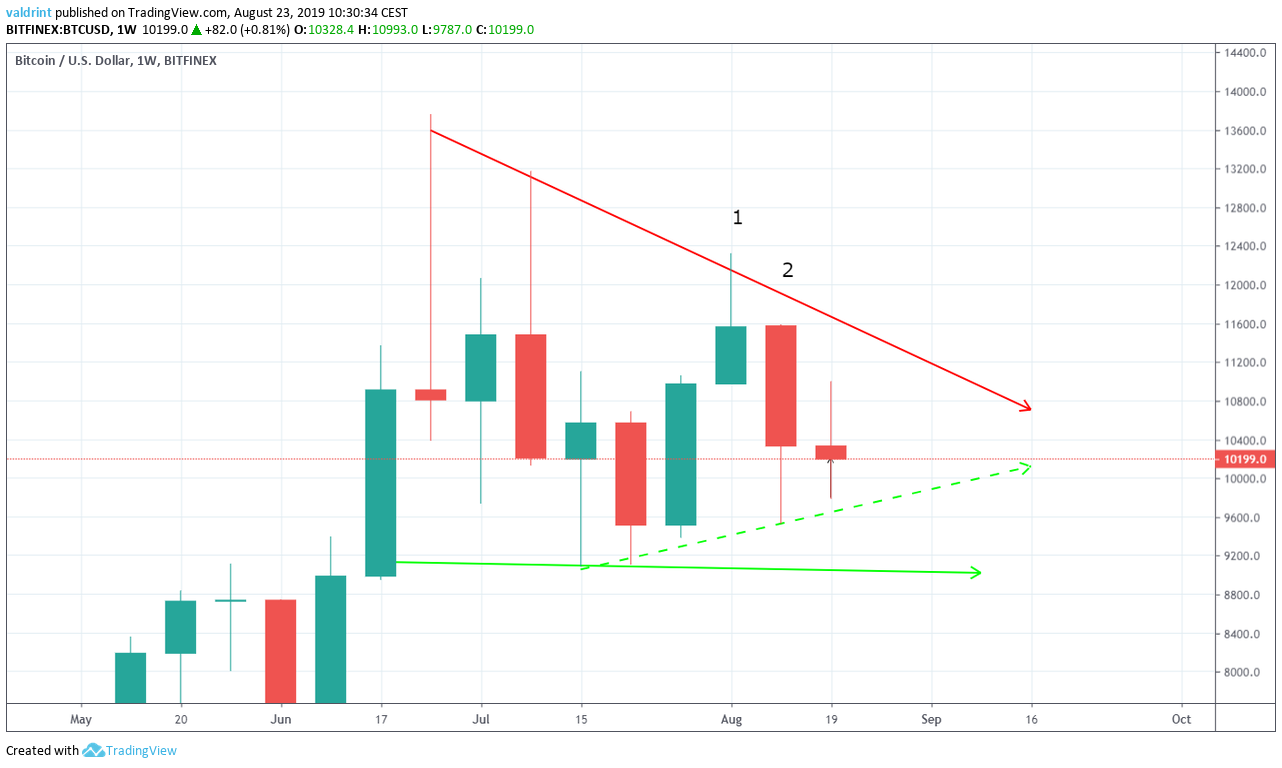
The Bitcoin price made a shooting star two weeks prior and followed it with a bearish candlestick.
The current weekly candle is a doji, indicating indecision.
A weekly close below $10,000 could be the catalyst for a rapid price decrease.
Bitcoin Price Prediction
The Bitcoin price is following an ascending support line.
According to our analysis, it is likely to break down and reach the horizontal support line near $9000.
