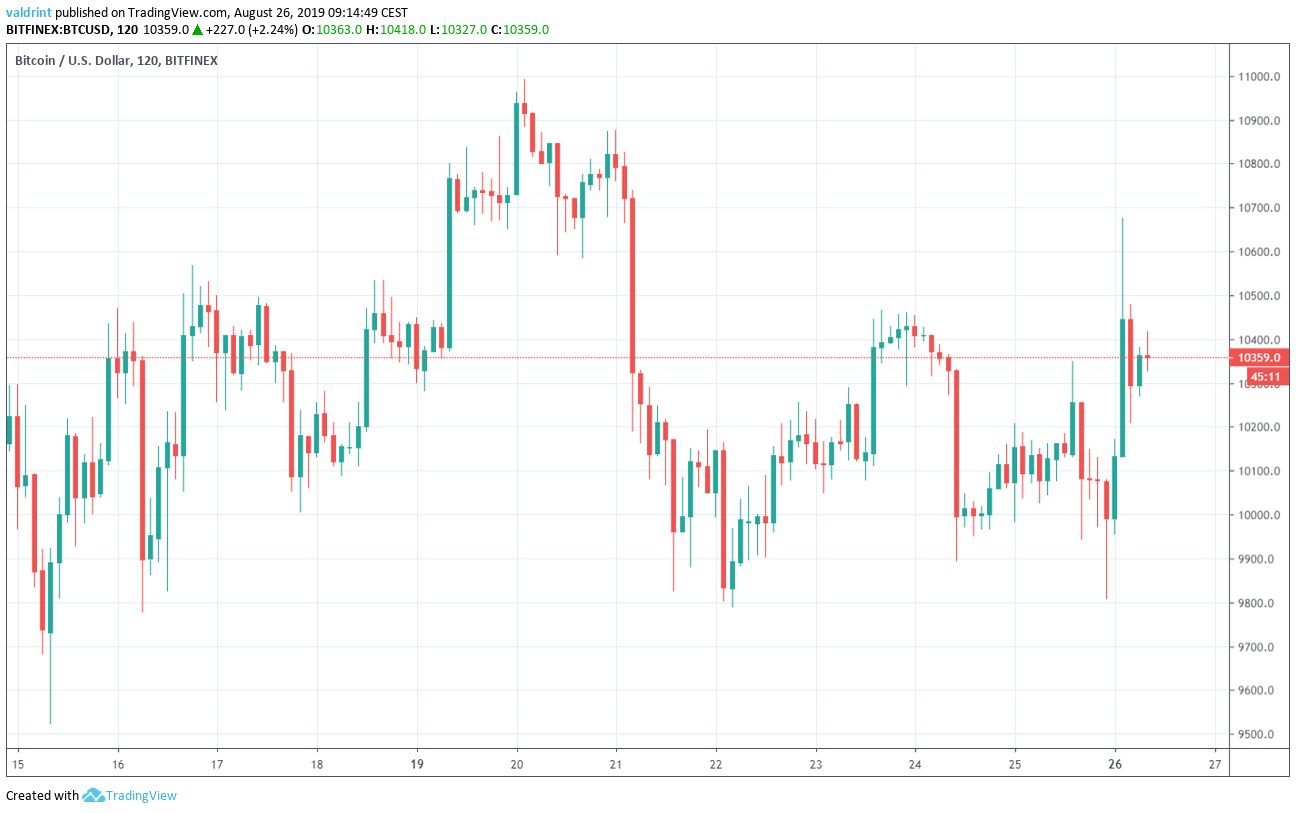
On August 15, 2019, the Bitcoin price reached a low of $9522. An upward move ensued and on August 20 the BTC price reached a high of $10,993. It has been decreasing since. However, it has made two higher lows on August 22 and 25, respectively.
Where will the BTC price go next? Continue reading below and find out.
Bitcoin Price: Trends and Highlights for August 26
Current Bitcoin Price Pattern
A look at the daily chart shows us that the price is following a descending resistance line.
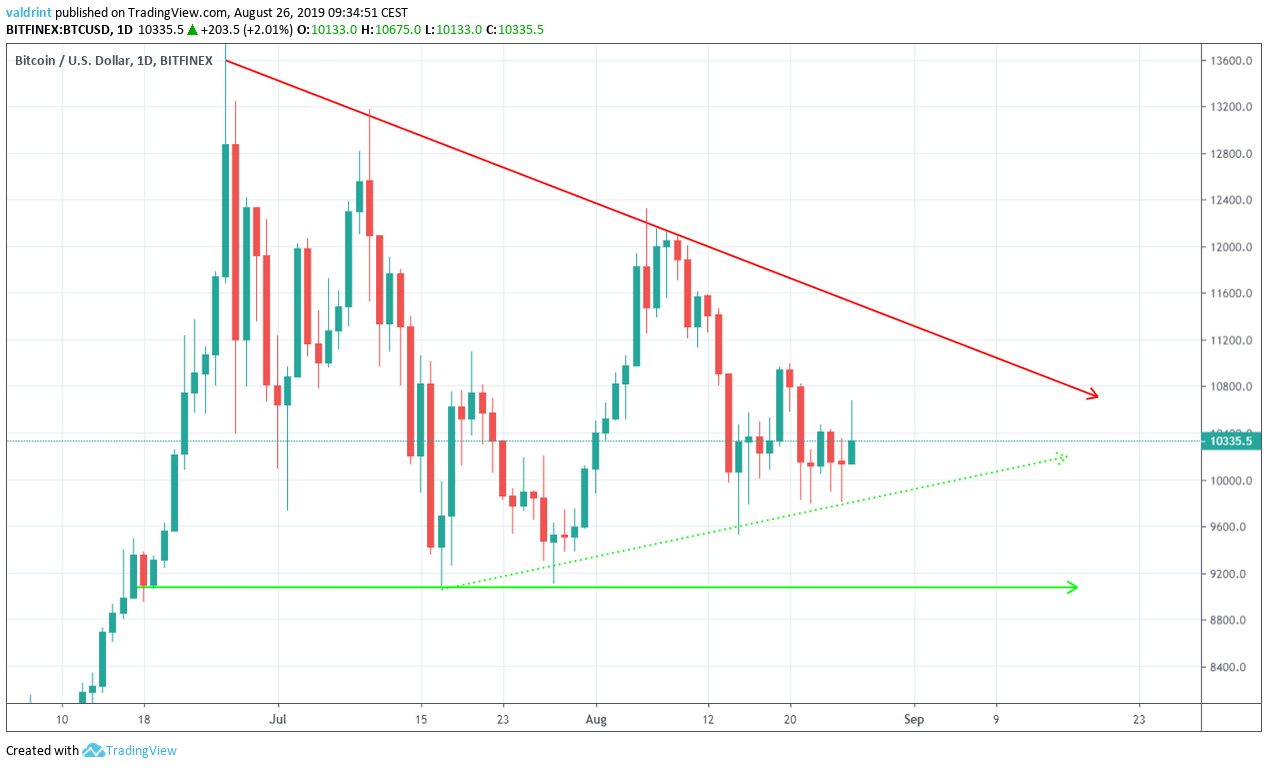
Additionally, it is following two support lines, one ascending and one horizontal, creating a symmetrical and a descending triangle, respectively.
The movement for the past two weeks has been characterized with long upper and lower wicks — indicating pressure on both the selling and the buying side.
A look at the moving averages (MA) reiterates this belief.
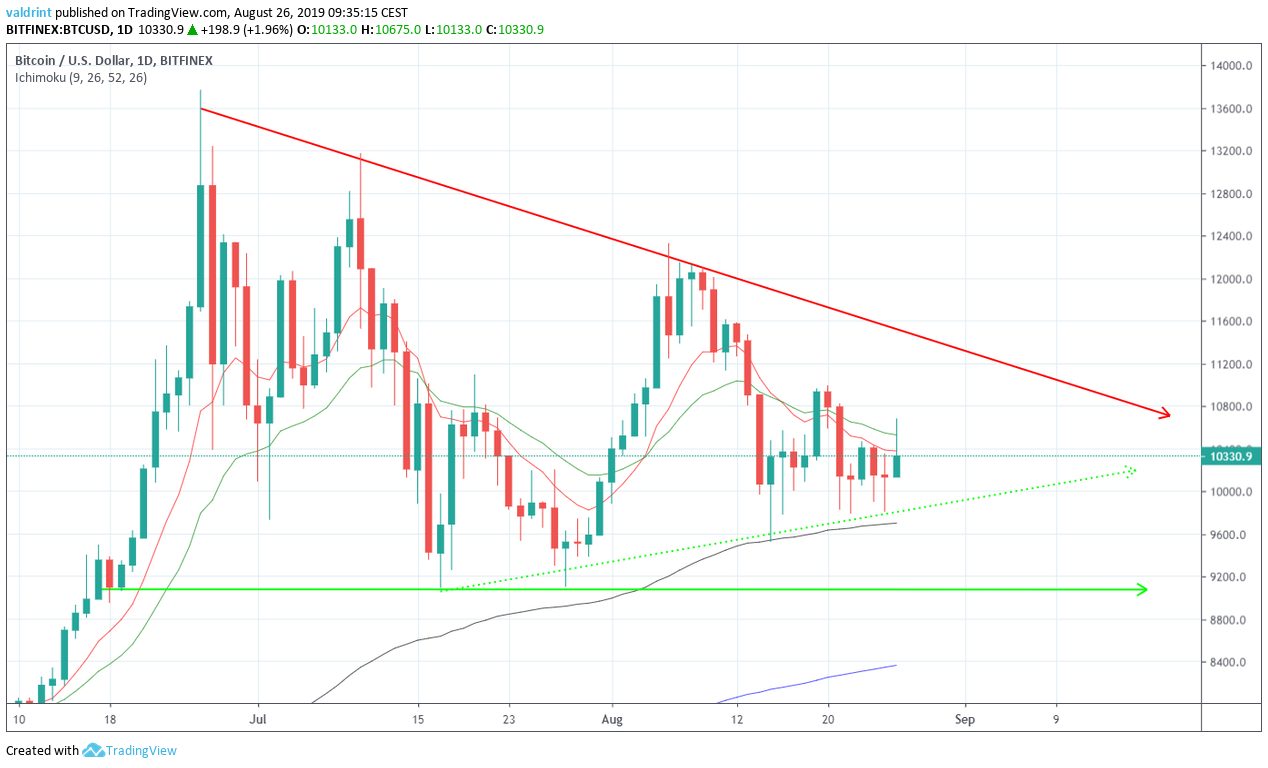
First, we can see that the Bitcoin price has found strong support above the 100-day moving average (black). This has been happening since August 13.
However, we can see that the most recent upward move has failed to move above the 10- and 20-day moving averages.
The fact that the price reached a high above them before retracing is a sign of selling pressure.
Symmetrical Triangle
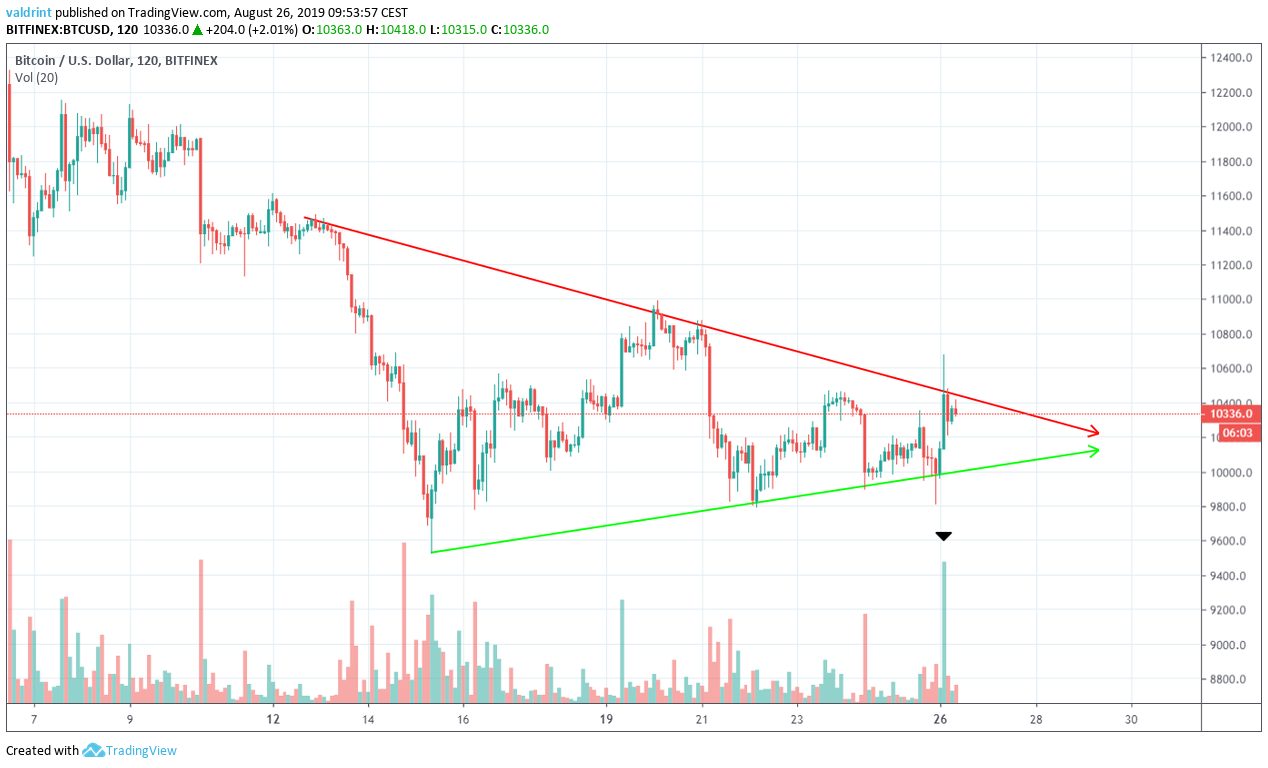
A look at the relatively short-term two-hour time-frame shows that the Bitcoin price has been trading inside another symmetrical triangle since August 6.
Also, depending on where you draw the resistance line, the BTC price is either attempting to break out or already broken out.
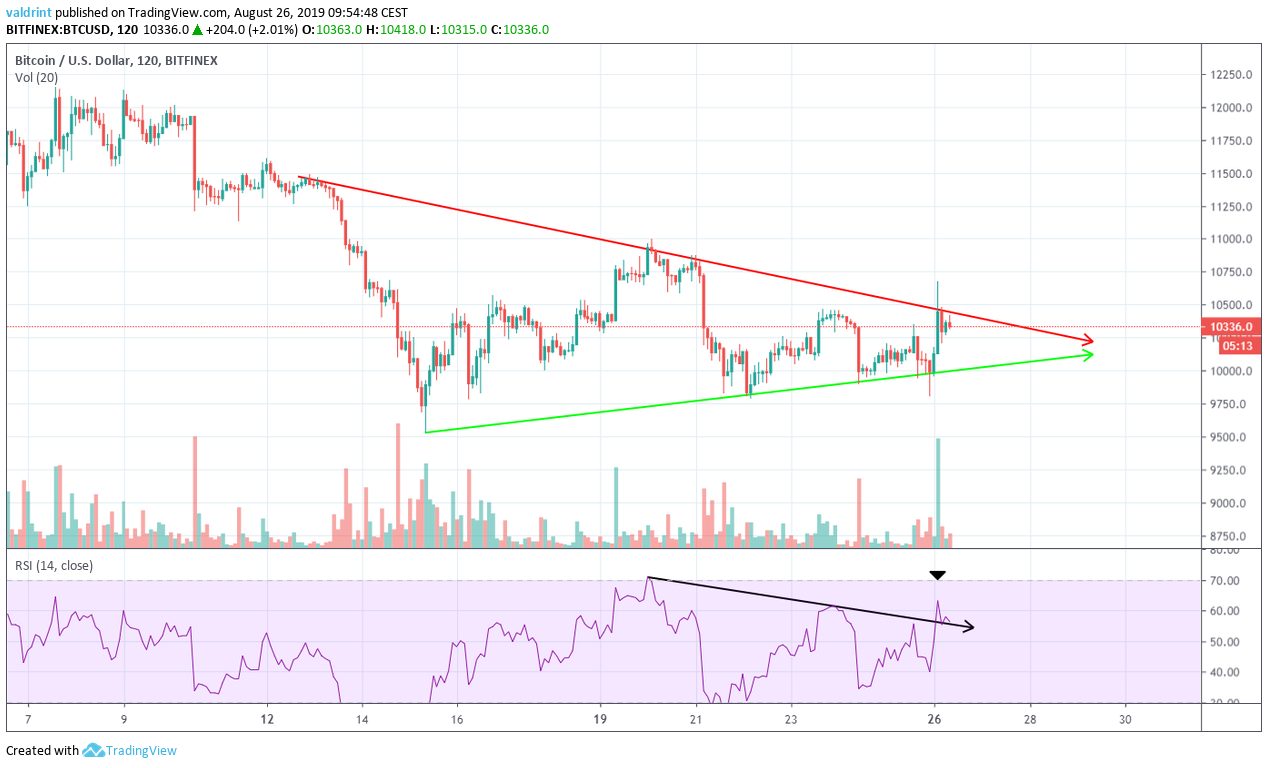
However, if we draw the resistance line in the RSI we can see that it has already broken out.
Finally, this attempt has occurred with very significant volume.
Looking at this move in the very short-term we can see that almost the entirety of the volume occurred on the bullish action.
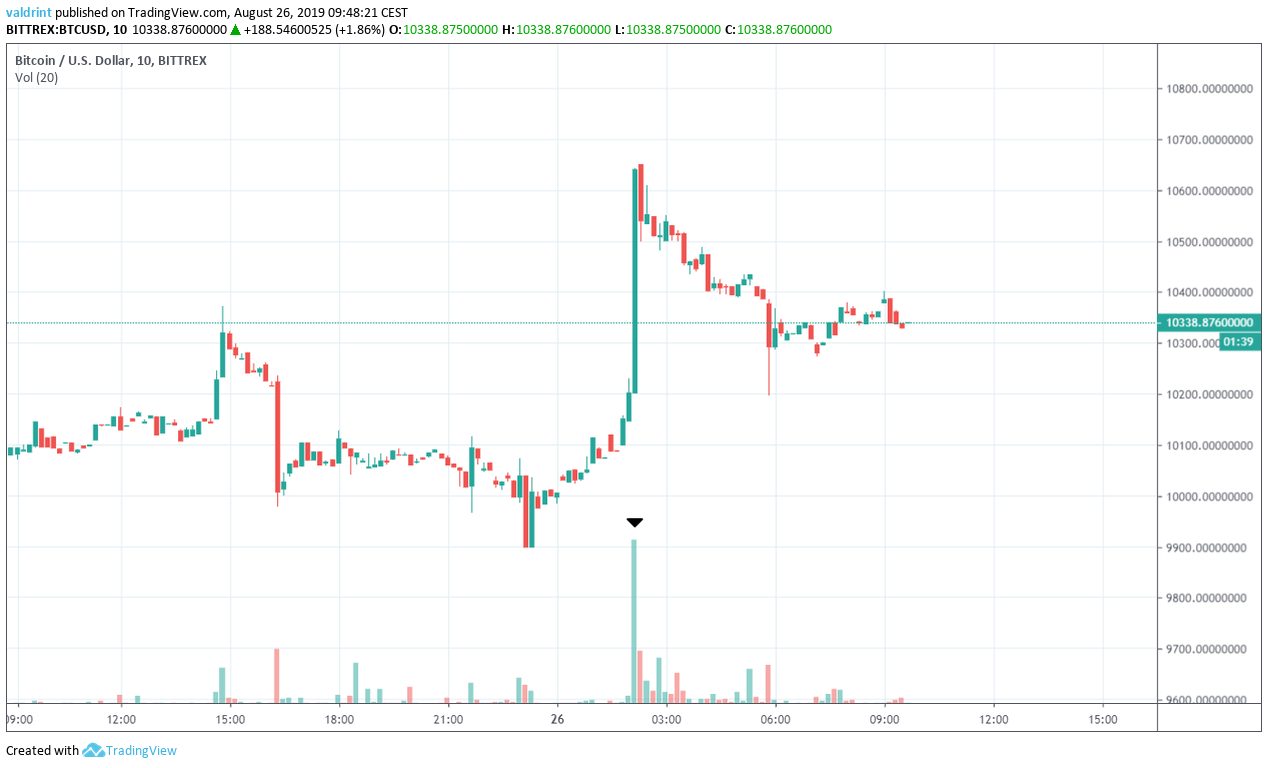
This makes us believe that the bulls have the strength and will eventually move the BTC price higher.
This makes us believe that if it has not already, BTC will soon break out.
Future Movement
If it does, one resistance area is outlined below.
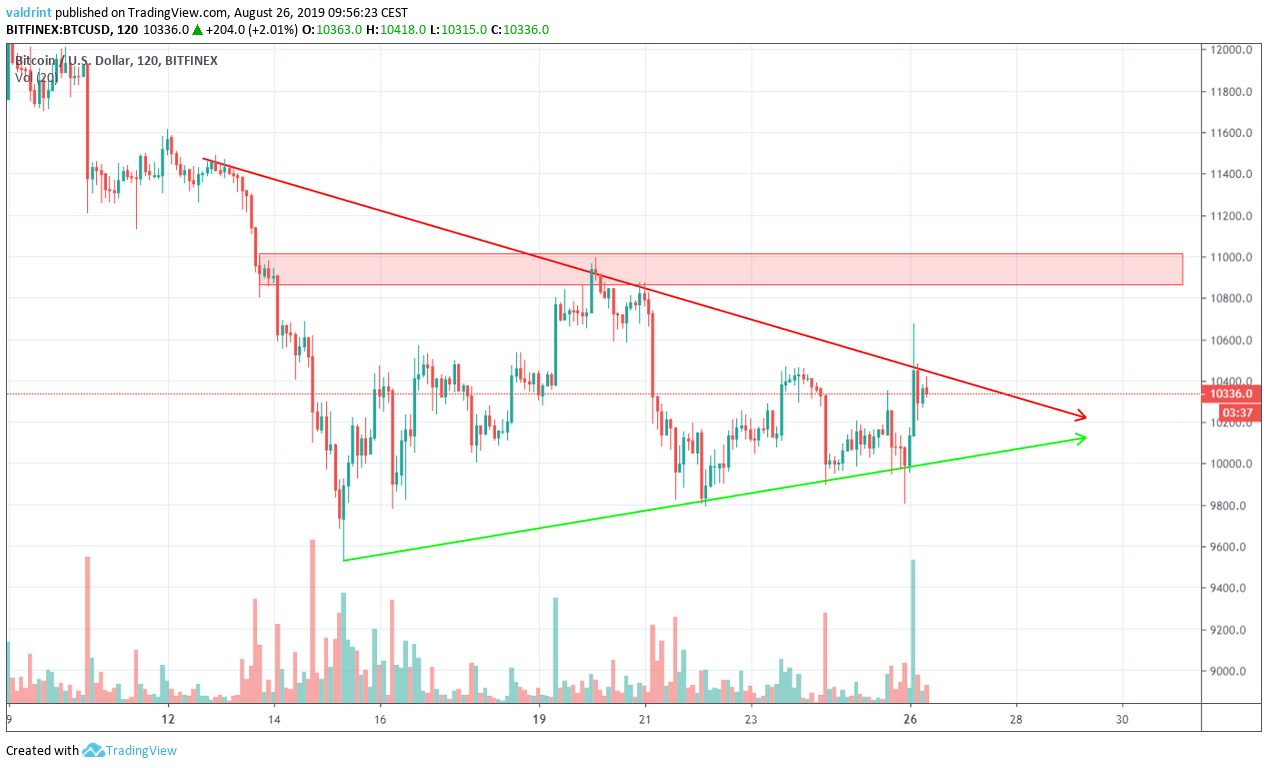
It is found at $11,000.
We believe that BTC will reach it.
However, it is possible that it continues trading inside the triangle before it does so.
Bitcoin Price Prediction
The BTC price is trading inside a symmetrical triangle.
For trading purposes, BTC could potentially be a buy-in short/medium-term time-frames.
However, we still think that BTC is likely in a longer-term downtrend, and has not made a long-term bottom.
