The total market capitalization of cryptocurrencies has plunged by as much as 23% from the highs of $89.9bn on Monday. The declines happened amid news that Google (NASDAQ:GOOGL) will follow Facebook (NASDAQ:FB) and ban cryptocurrency and ICO advertisements on its applications. The Google ban will come into effect in June of this year. It is also understood that Bitcoin prices have come under pressure, as a trustee of the now-defunct exchange Mt.Gox has been selling large amounts of bitcoin to pay back creditors. Bitcoin has dropped to a price of around $8000, where it is at the break-even cost of mining. This may encourage some miners to turn off machines until the price recovers.
Bitcoin
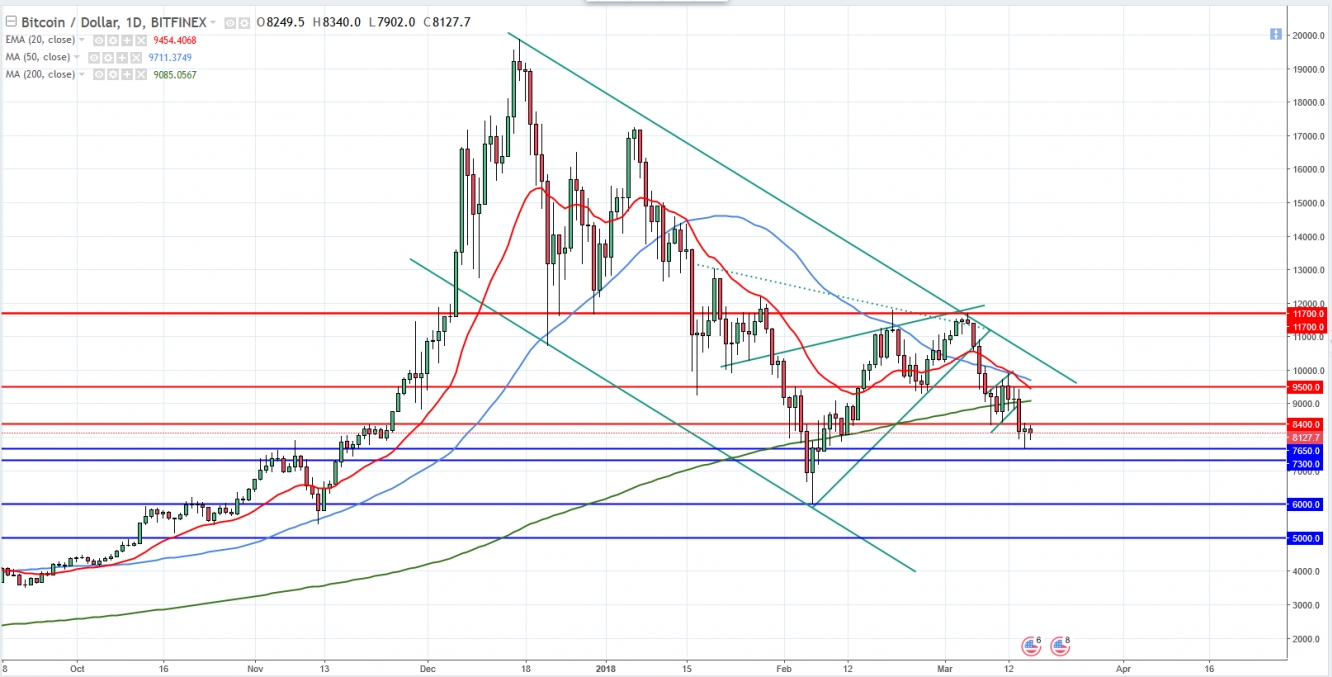
On the daily chart, bitcoin continues to play out the double top pattern identified in our previous report. The measured target is at 7,300, near the 78.6% Fibonacci retracement. Furthermore, BTC/USD is now trading below the 200MA. Immediate support is at 7,650 and a break will open the way to further declines towards the February lows of 6,000. To the upside, a reversal and break of 8,400 is needed to change the outlook, with major resistance at the 200MA and then 9,500. A move above the falling resistance trend line will be required for the picture to turn bullish.
Ethereum
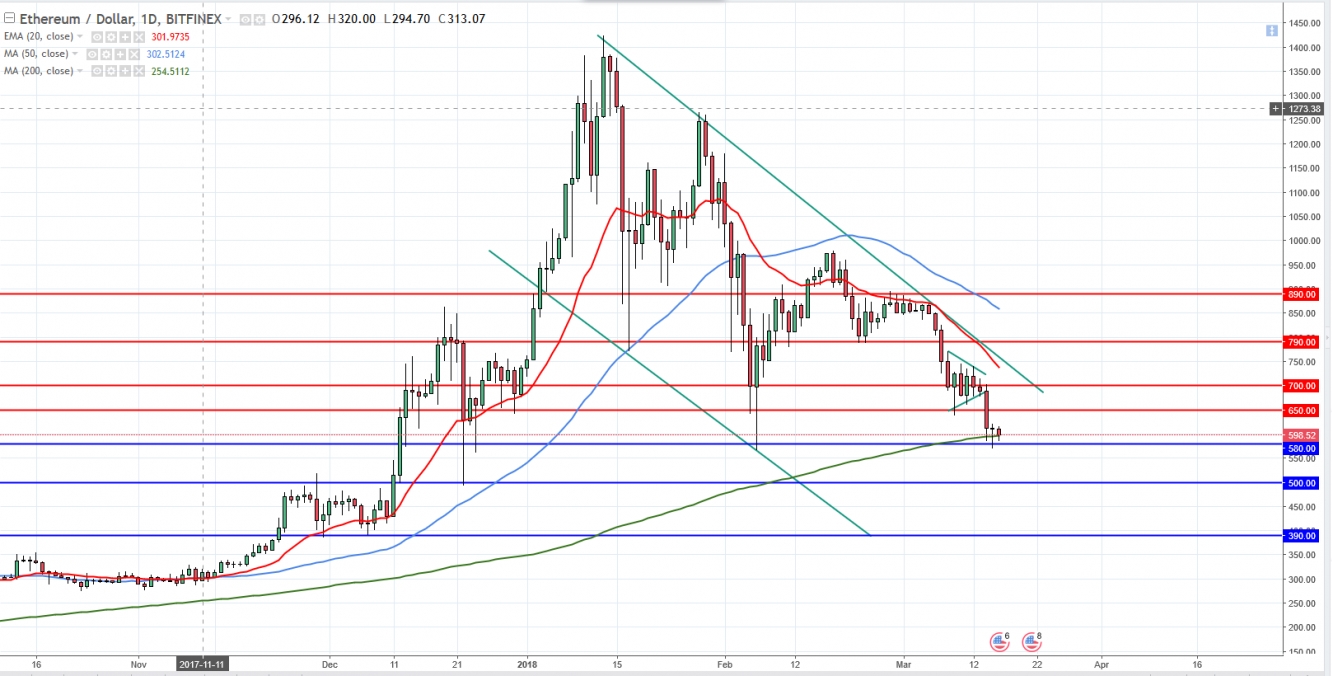
On the daily chart, ethereum decisively broke the 650 support zone and is now testing the 200MA near 850. A breakdown will open the way to further declines towards support at 500, followed by 390. On the flip side, a bullish reversal and break above 650 would find resistance once again at the falling trend line near 700, followed by 790.


