Updating the Bitcoin scenario for the nearest future In this post I used: fundamental analysis, panoramic market survey, market balance level analysis, market volume analysis, graphic analysis, trend analysis, Renko, Kagi, tic-tac-toe.
Welcome to my daily crupto currency forecast. The week has passed, which means that it's time to update the scenario and the forecast for Bitcoin.
In order to do this, first let us check my forecast from last week and estimate how accurate it was.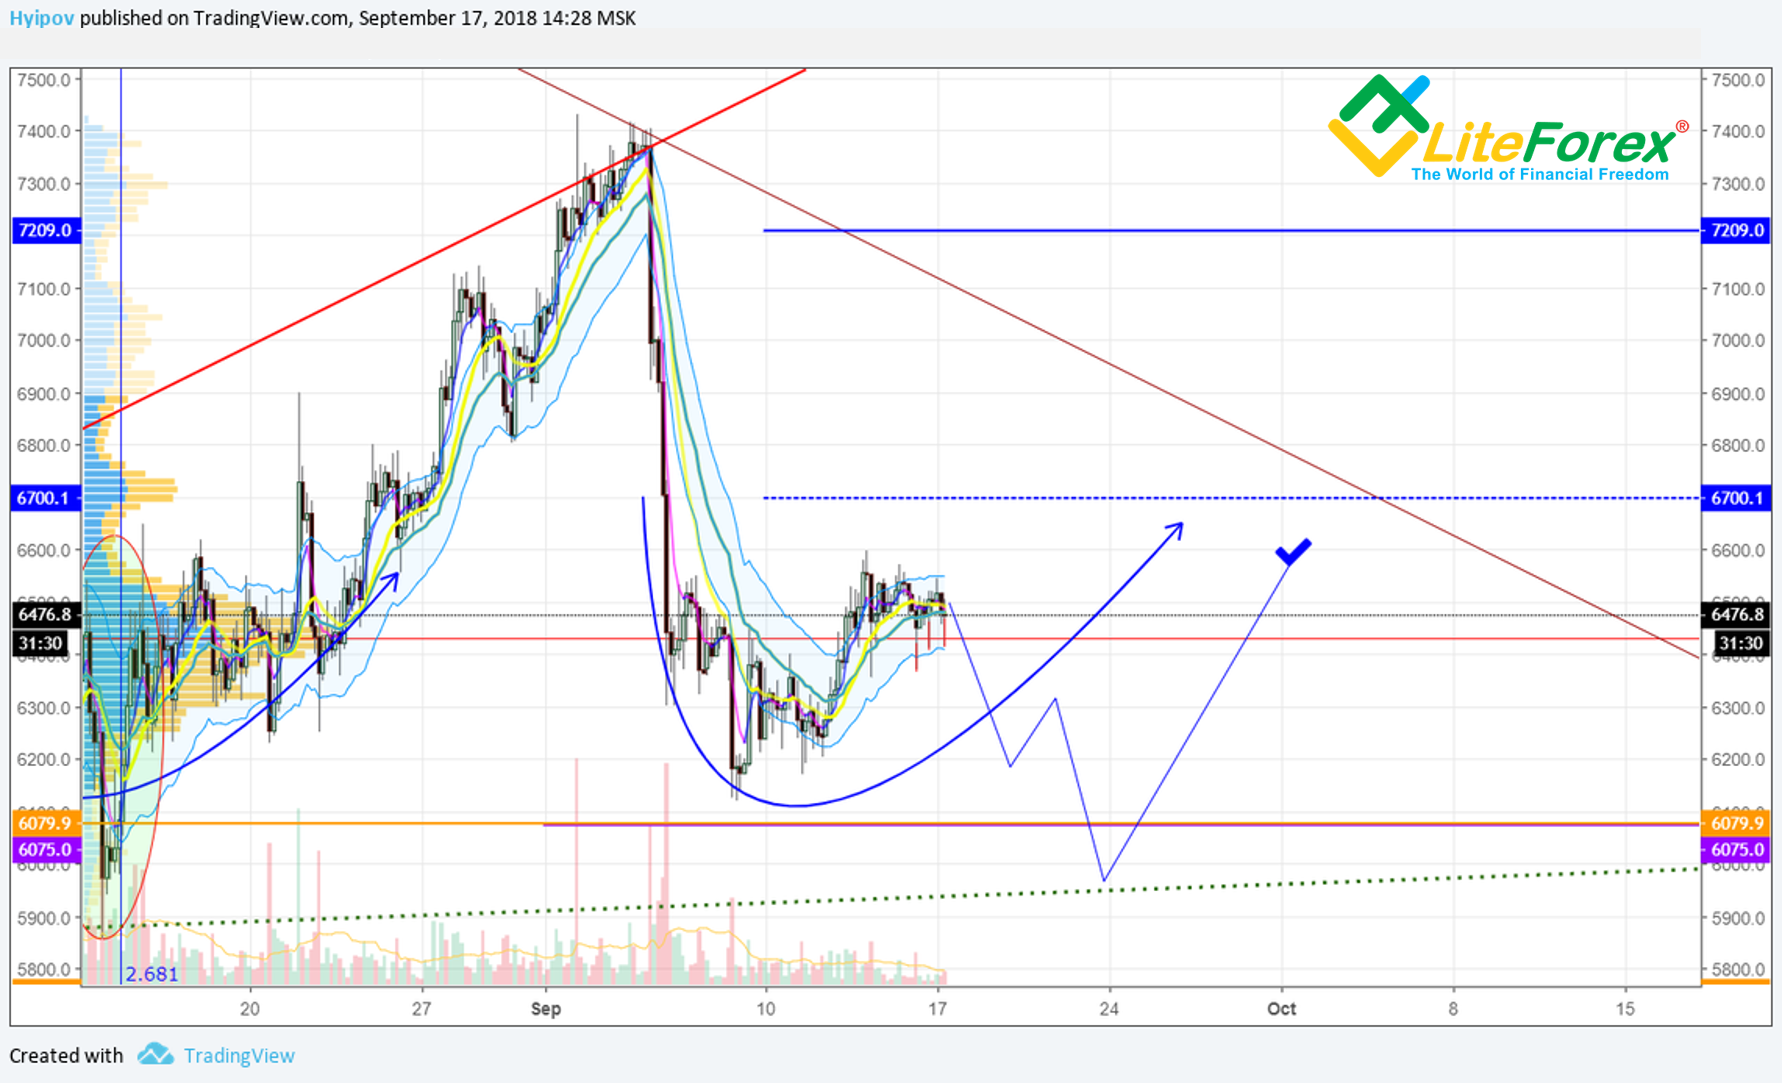
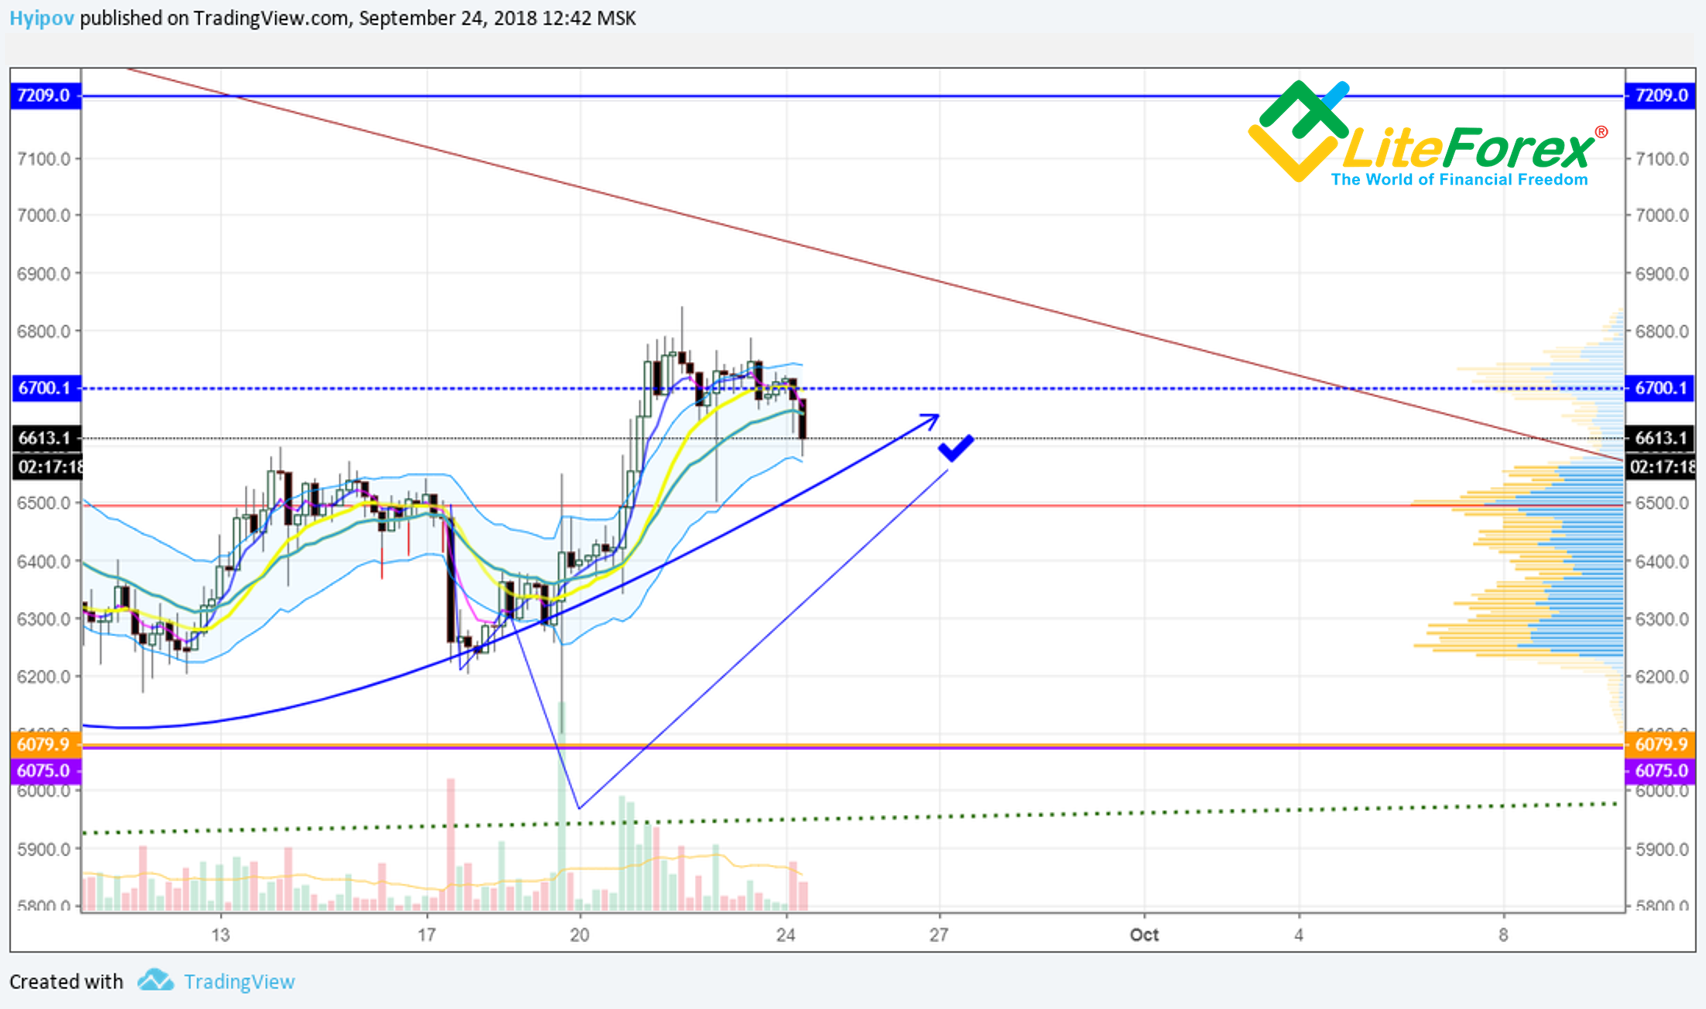
As we can see, in general, the forecast worked out perfectly. This level of support at 6079 USD was even stronger than expected. That sale, which was arranged by the manipulator, was almost completely bought out, which once again confirms the strength of the buyer in this area.
Now the ticker is already close to the target indicated last week and now my task is not to update, but to build a new forecast, since the previous one has been realized.
Fundamental analysis of the BTC/USD
First of all, let's have a look at the news around bitcoin and how it could change the sentiment on the market. In general, then the news background of the last week was negative.
1. On September 18, it became known that Bitcoin core conducted an urgent update of the network due to a critical vulnerability discovered about two years ago.
2. September 18 - news about the theft of 60 million USD from the Japanese stock exchange Zaif.
3. September 22 - Ton Weiss (famous crypto analyst and trader) said publicly, at Baltic Honeybadger 2018 in Riga, that Tether will soon cease to exist.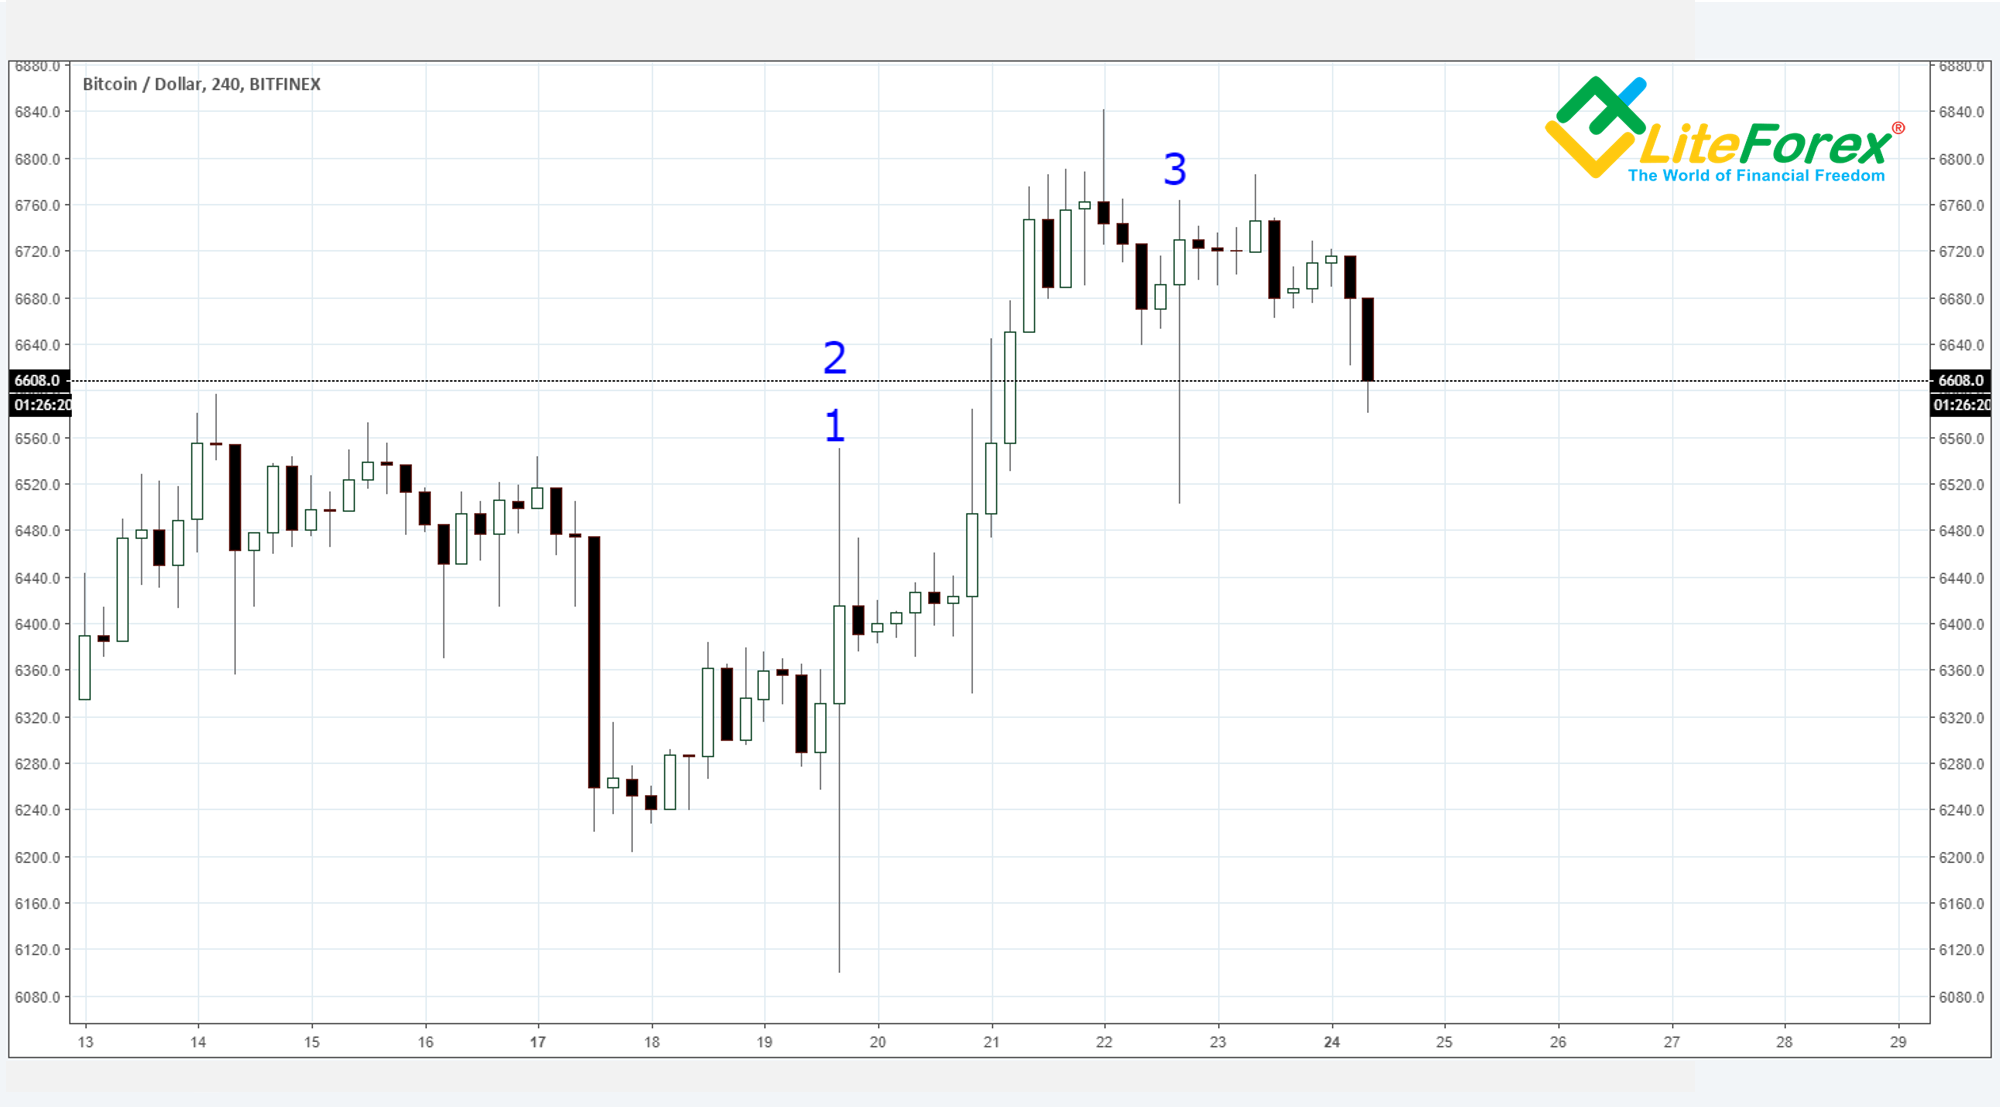
As we can see in the chart above, none of the three negative events could bring down the ticker down. The sharp sale was quickly bought out in the first and second cases. This phenomenon indicates that the market is gradually shifting sentiment from panic and fear to cautious optimism.
Fear index from alternative.me only confirms this statement.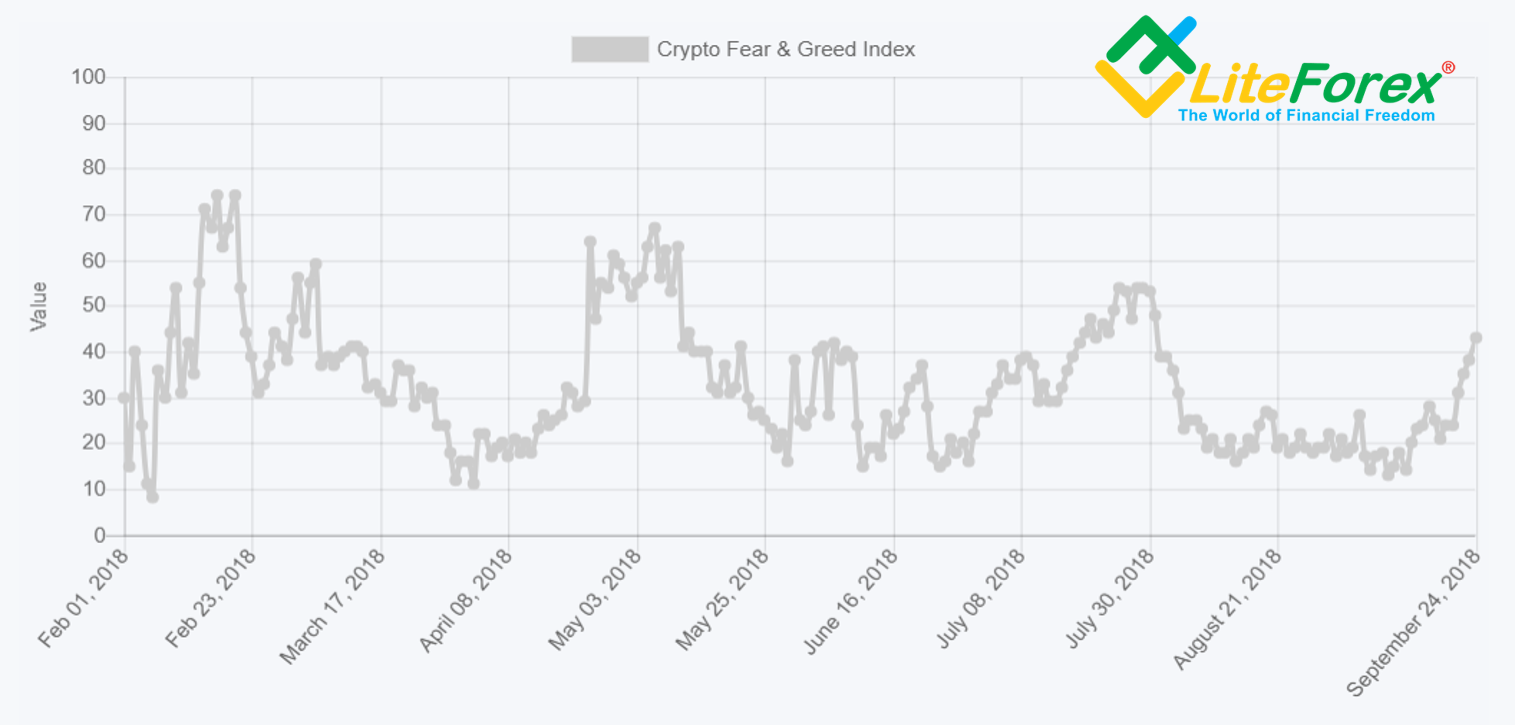
We see how despite a small correction, which is now developing in the BTC/USD pair, the bulk of the participants look at the market positively, which is great.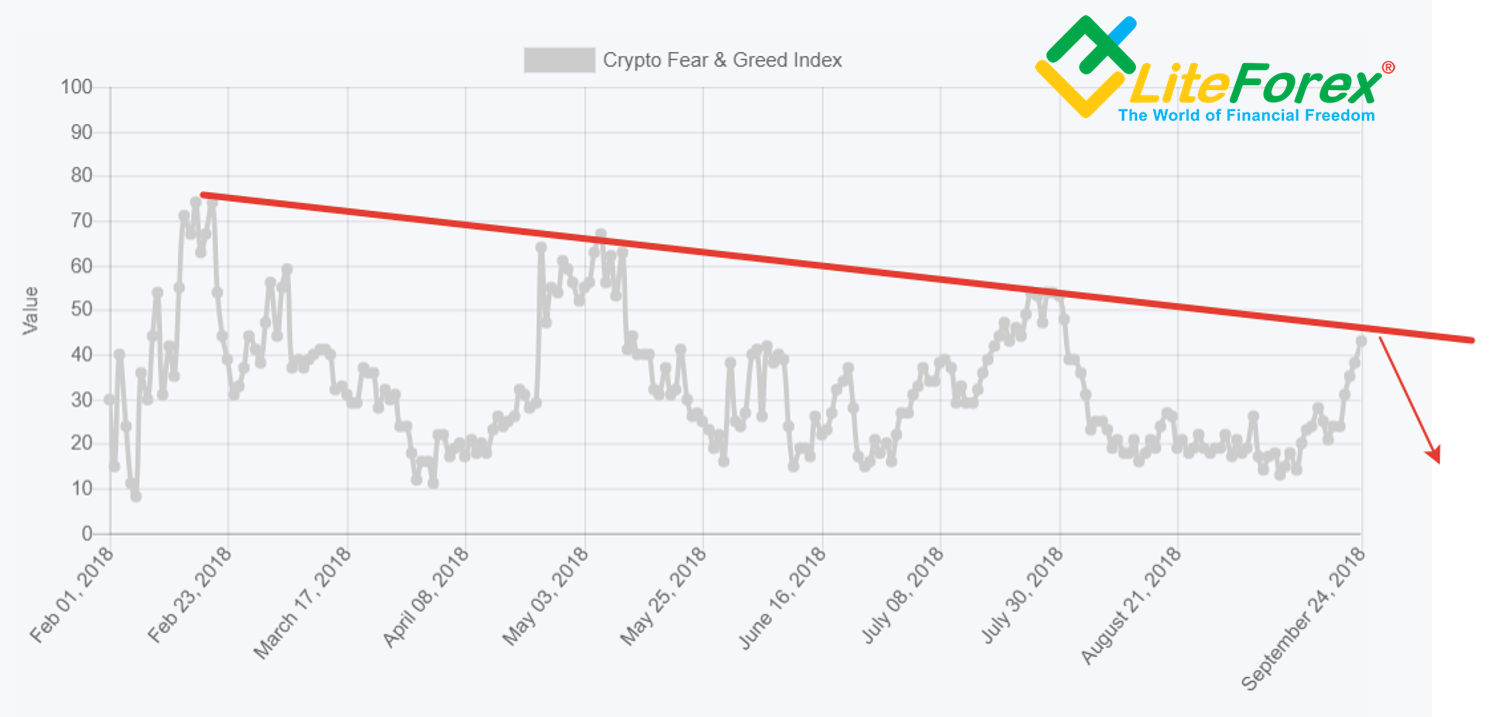
However, one can not fail to notice a certain cyclicity in this chart consisting of fading sinusoid fractals. If we draw a trend line that would connect all three last peaks of the positive mood of the market, we can see that the current state of the market is approaching its peak value and in case of a rebound from the resistance level, we will see another wave of negativity and a decline in the crypto currency market.
BTC/USD Technicals
In order to confirm or refute this hypothesis, we will do a panoramic analysis of the market.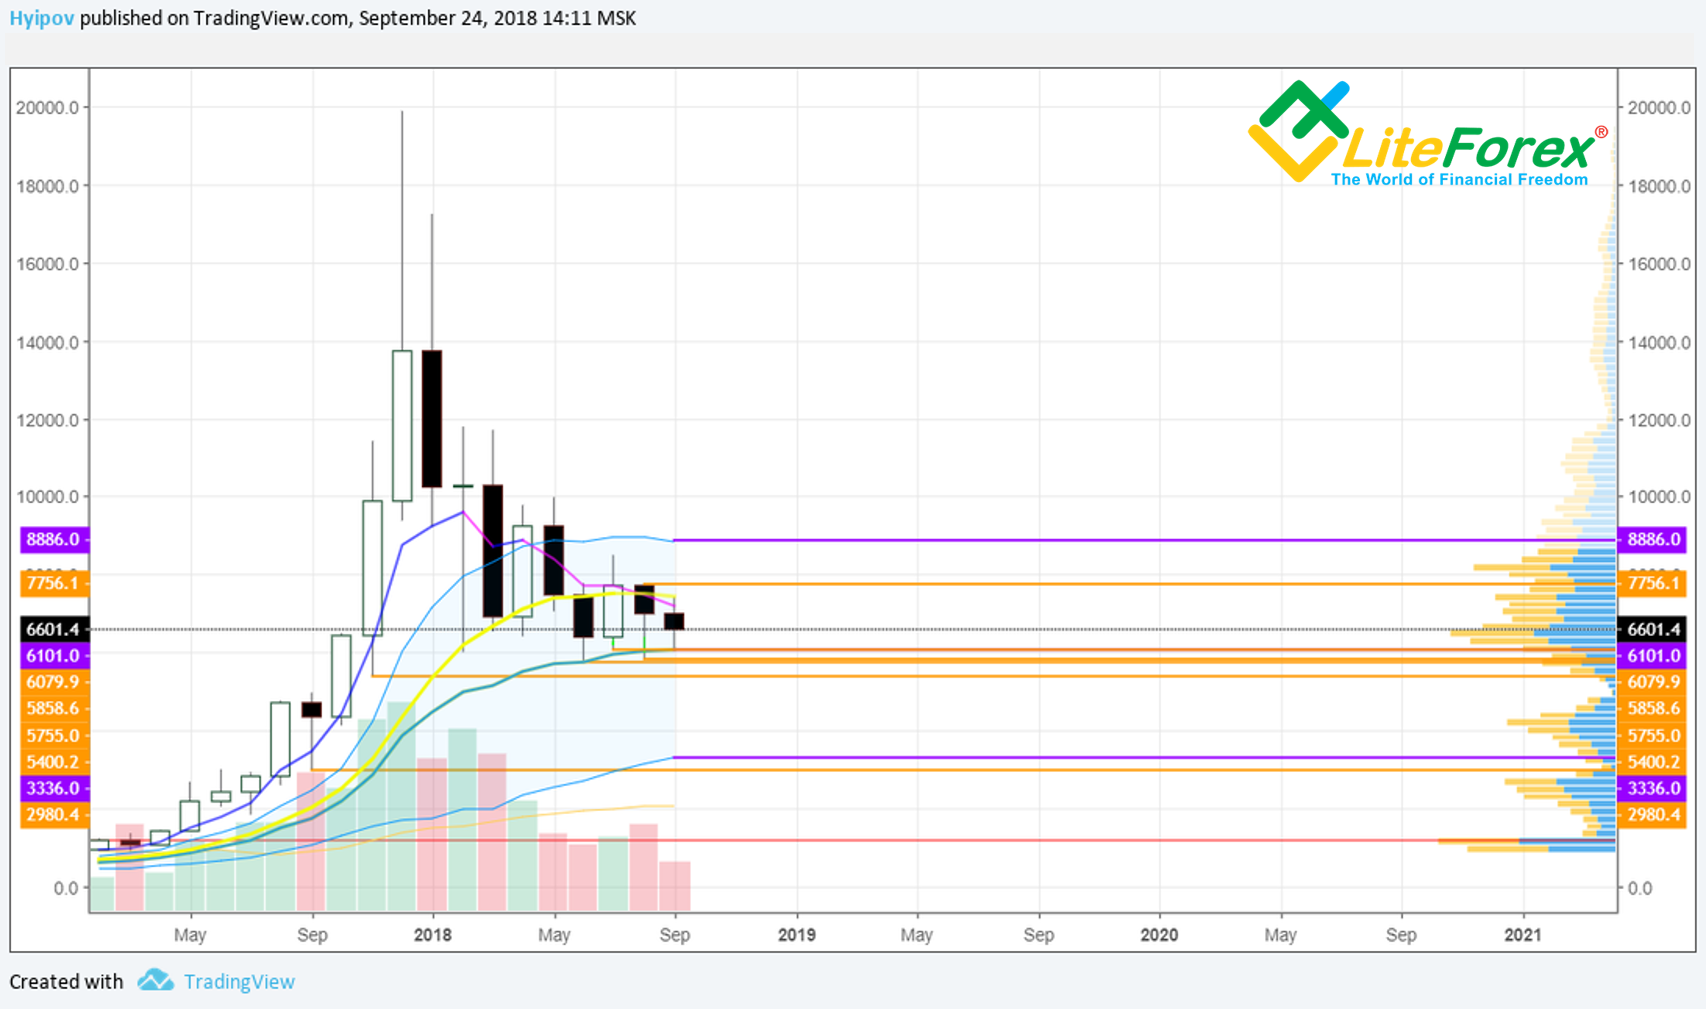
As we can see in the chart above, starting from the level in 6101 and up to the level of 5400 there is a big accumulation of support levels. This includes both the lows of recent months, and the average monthly Keltner channel, which is now at 6101 USD.
In its totality, this cluster of levels is a fairly dense support zone, which the bears will have a very difficult time breaking through.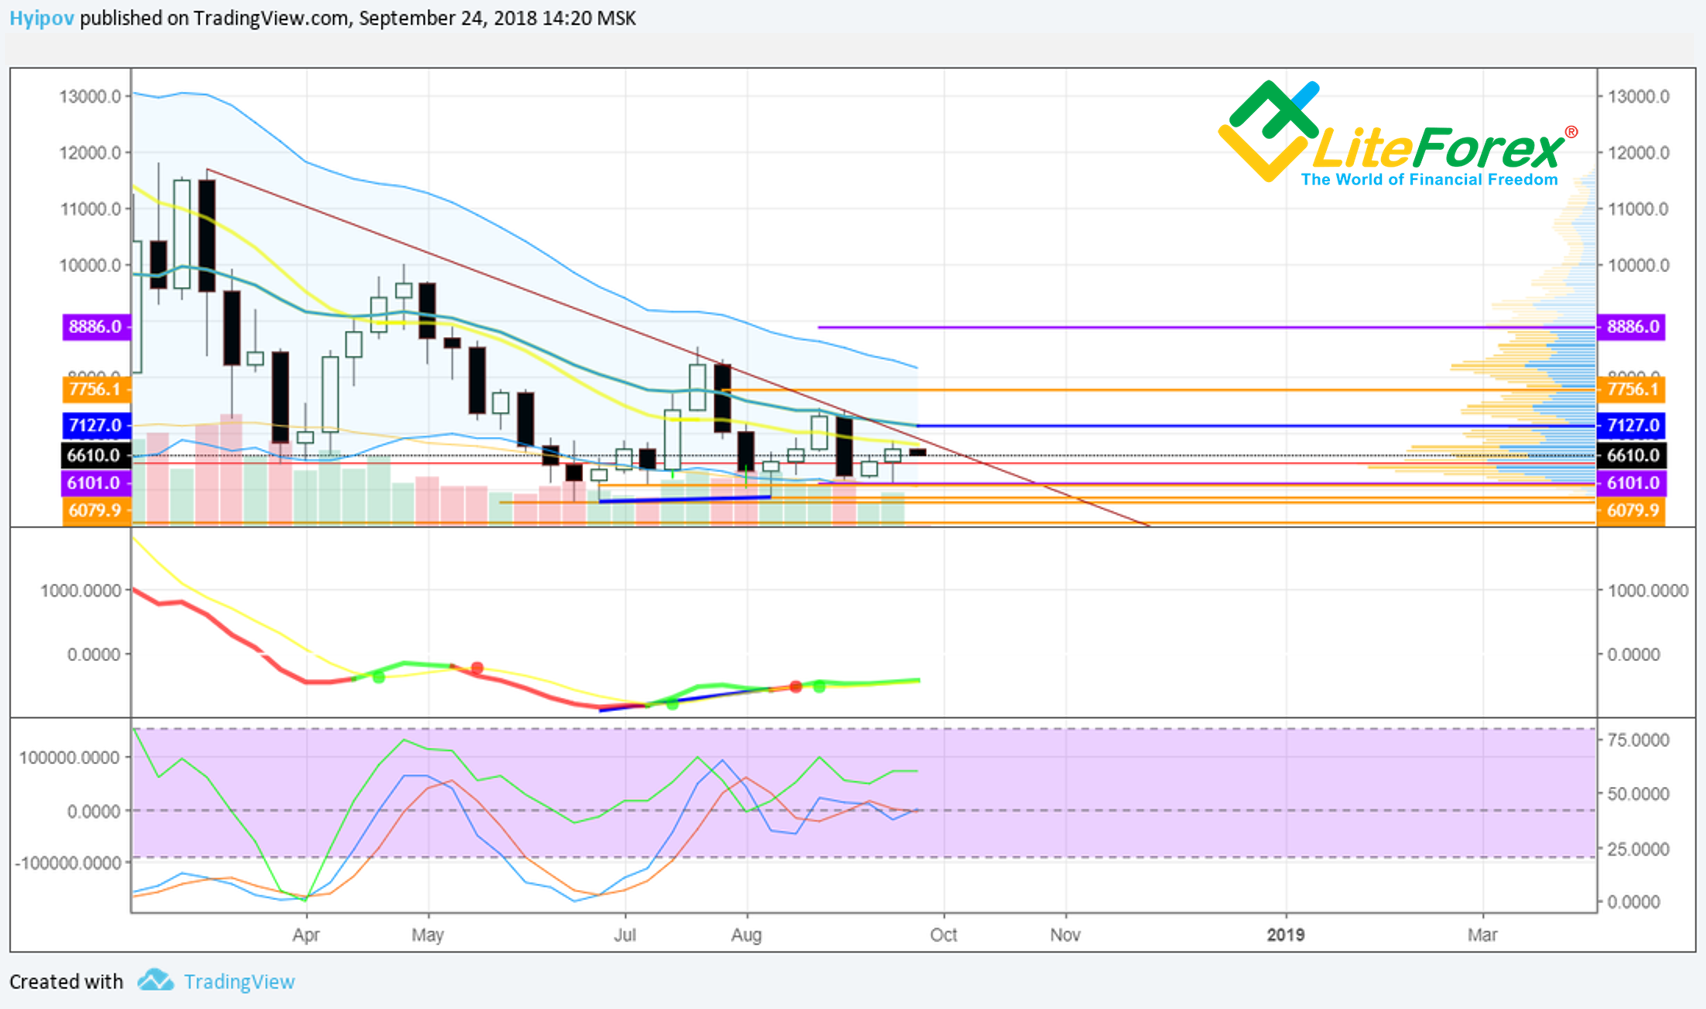
In the weekly chart, we see that the BTC/USD ticker is not in a simple position. From above it is clamped by an inclined trend line, and from the bottom - by a strong support zone, at the approach to which the market begins to buy back.
MACD on weekly TF keeps optimistic, and the stochastic RSI remained neutral by moving exactly in the middle.
In general, the situation in this TF is not unique and we definitely cannot say where the market will move further, but it can be confidently concluded that the current state of the ticker speaks of its consolidation, which is a clear sign of an impulse.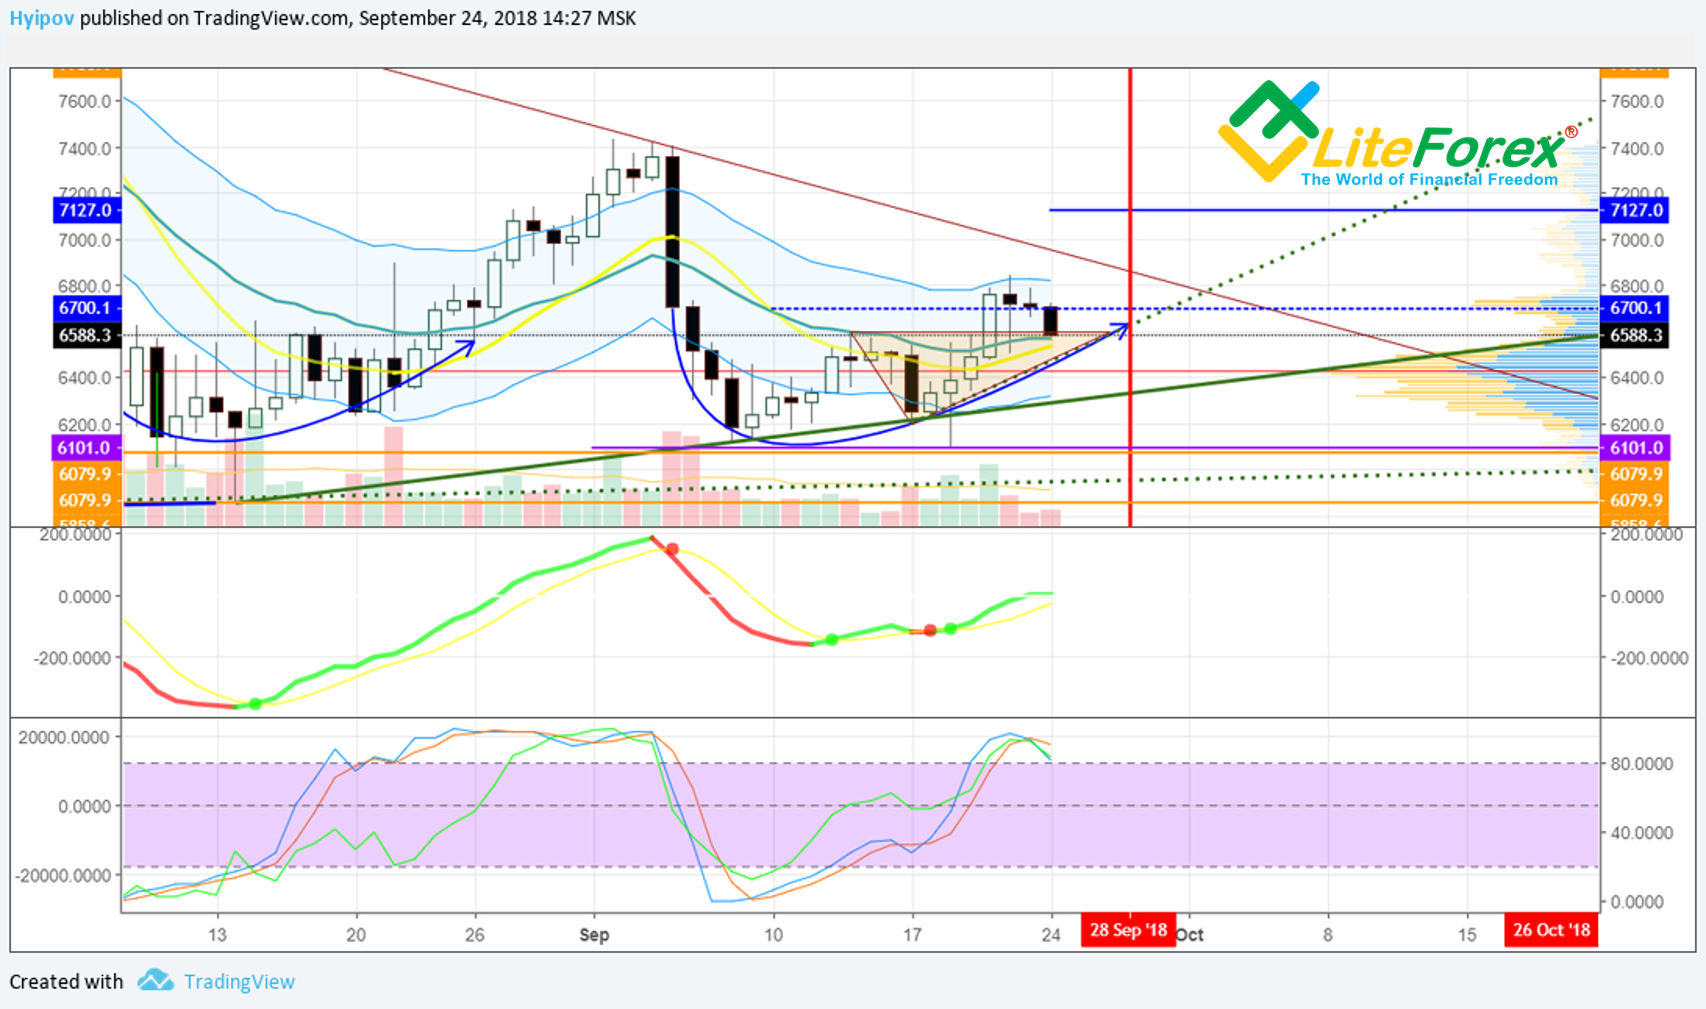
In the daily chart above, we see that the ticker goes into the spread and now rests on the support zone, which is in the area of 6550 USD. The probability of breaking through this zone is quite high. This is indicated by a bearish reversal on the stochastic RSI and low volumes of the previous two days, the shape and color of which also indicates the lack of interest on the part of the buyer in these values.
A little to the right, in the chart above you can see the red vertical line, which is marked on September 28. On this day, an expiration of six-month bitcoin futures (code BTCU18) from the Chicago commodity exchange CME Group (NASDAQ:CME) will take place.
As a rule, on the eve of this event, the market is in a strong trend movement. The market usually starts moving in the opposite direction after the closing date of futures.
Given the reversal pattern, we can assume that the ticker will continue its decline until September 28.
In the framework of our experiment with price charts, we have already looked at the Renko, Kagi, the linear breakthrough chart and tic-tac-toe.
Now it will be interesting to compare the values they give at the moment with the classic Japanese candlestick chart.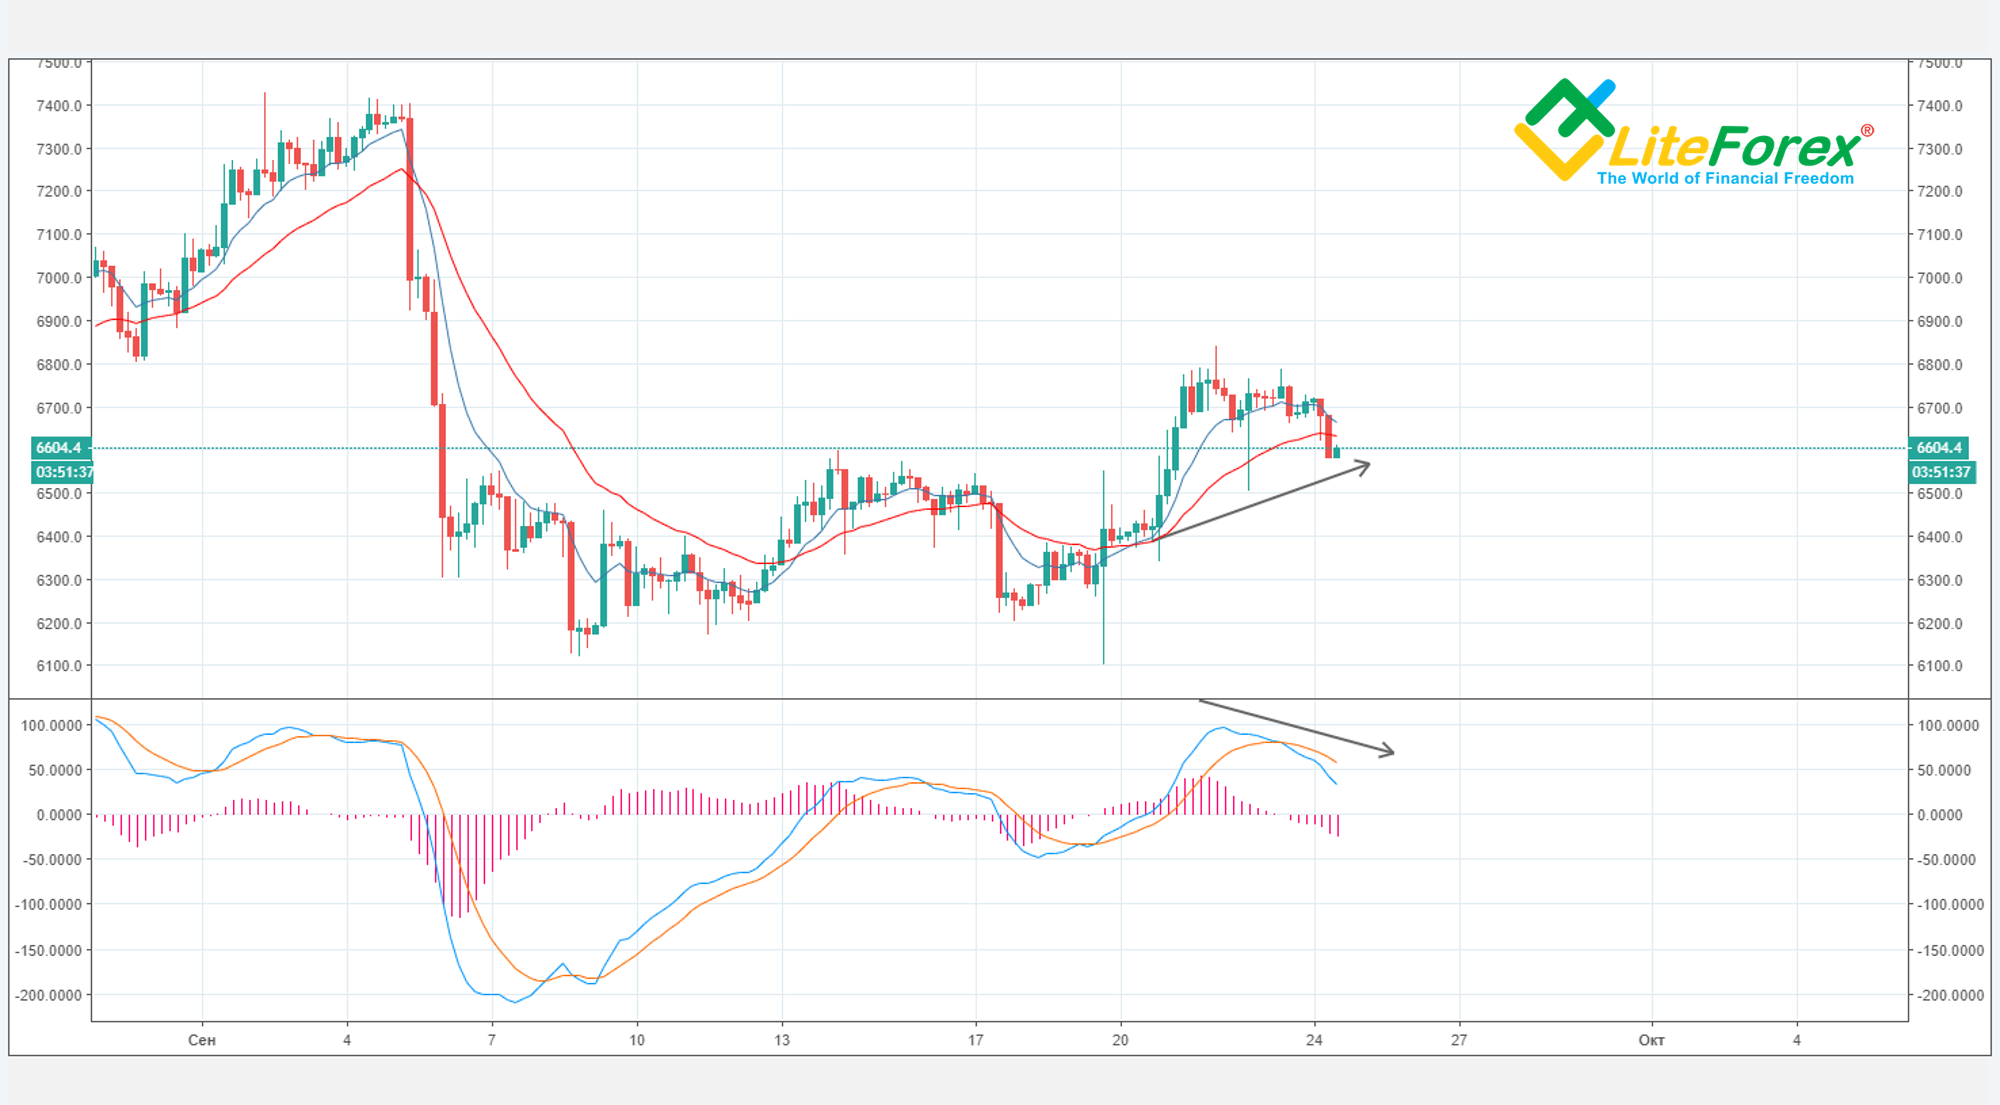
As we can see, we have a multidirectional movement in the classic Japanese candlestick chart. MACD shows a turn towards the bears, and the moving averages are traditionally late and are still in the purchase zone.
Now let's compare this picture with what we see in our unusual price charts.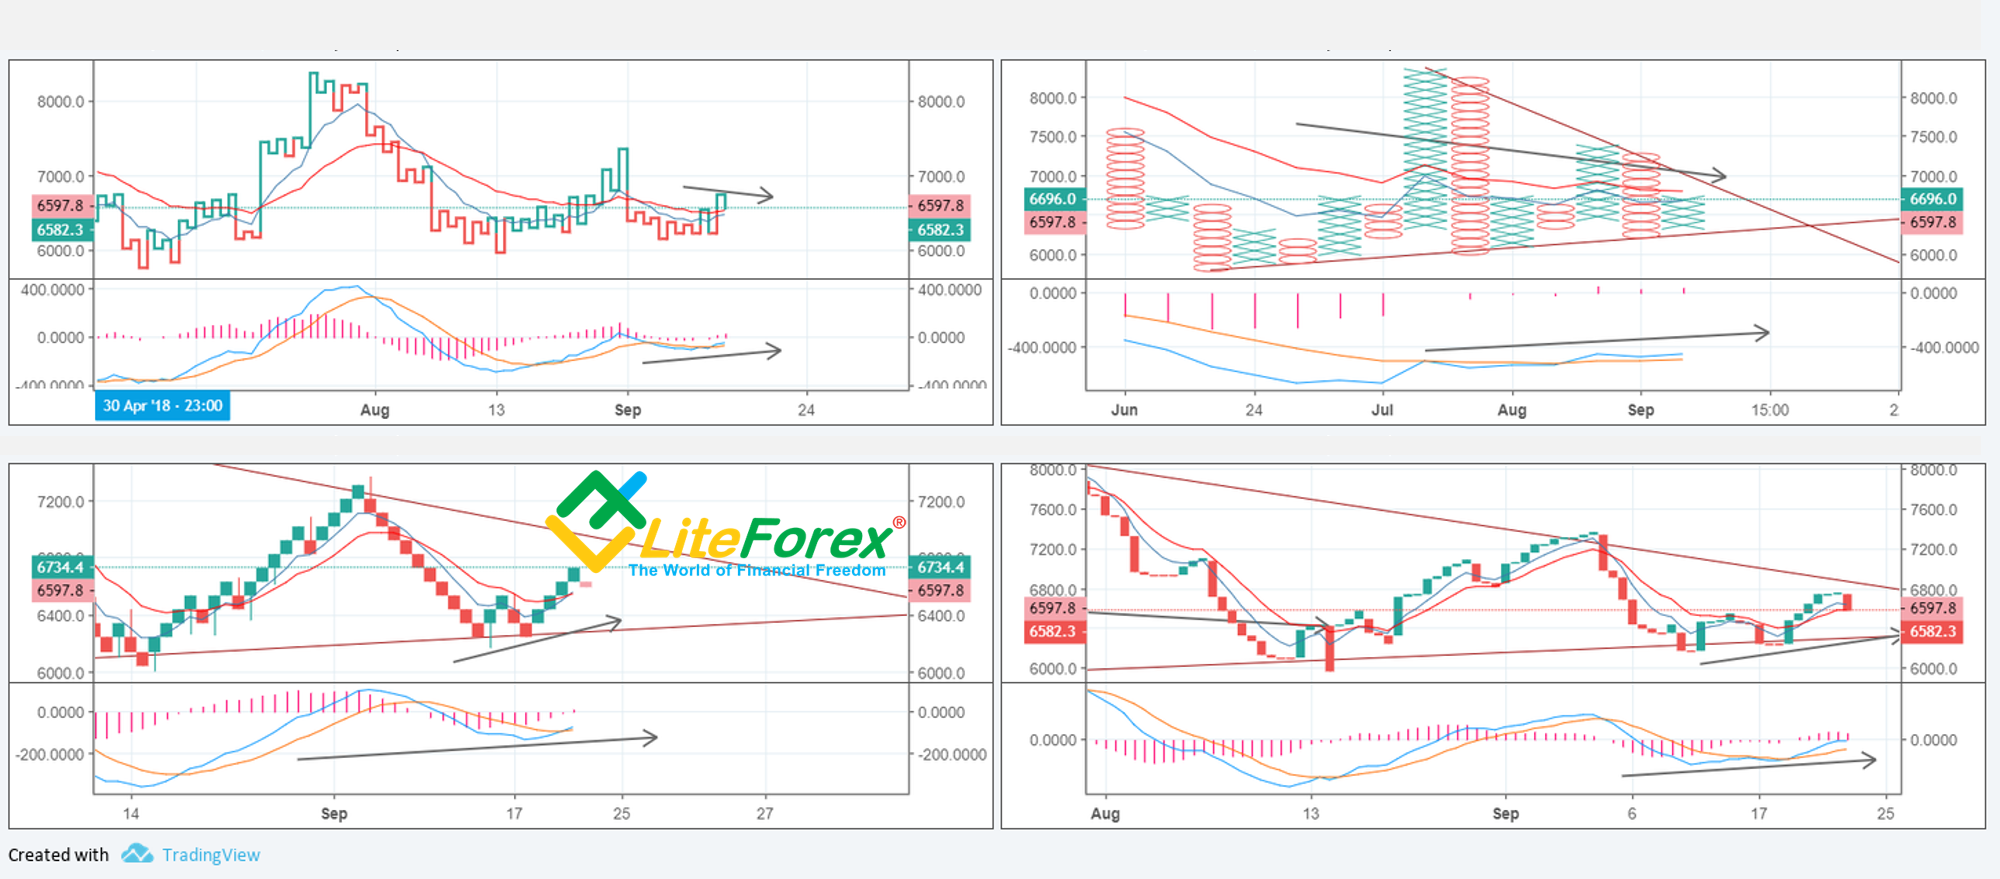
In the charts above, we see that the picture is different from the one in the Japanese candlestick chart, while the chartis not similar either.
The Kagi chart (top, left) and the tic-tac-toll chart (top, right) are very similar in their indications, and both indicate continuation of the fall using the MAs, and the MACD shows the bullish intersection. At the same time, we can see that there were no signals for purchase on the Tic-tac-toe MA chart, which speaks in general of a very high threshold for the sensitivity of the indicator, and hence a great lag.
Kagi and Renko are not much better in this respect, and they also show the signal with delay.
The most sensitive indicator turned out to be the linear breakout chart, however, even it lags behind the Japanese candlesticks. Nevertheless, it is the linear breakout graph that gives a clear signal for the reversal. We see in the right bottom chart that the ticker is already dressed in a red "suit".
However, high sensitivity is neither good or bad. All of the above price charts fulfill one main goal - filtering market noise, and each type of chart fulfills this task by virtue of its design features.
Our goal is to read out the signals that these charts give. And in this case, they all point to the development of prices in the form of a sideways movement and finding the market in a certain equilibrium position.
Updated Scenario For BTC/USD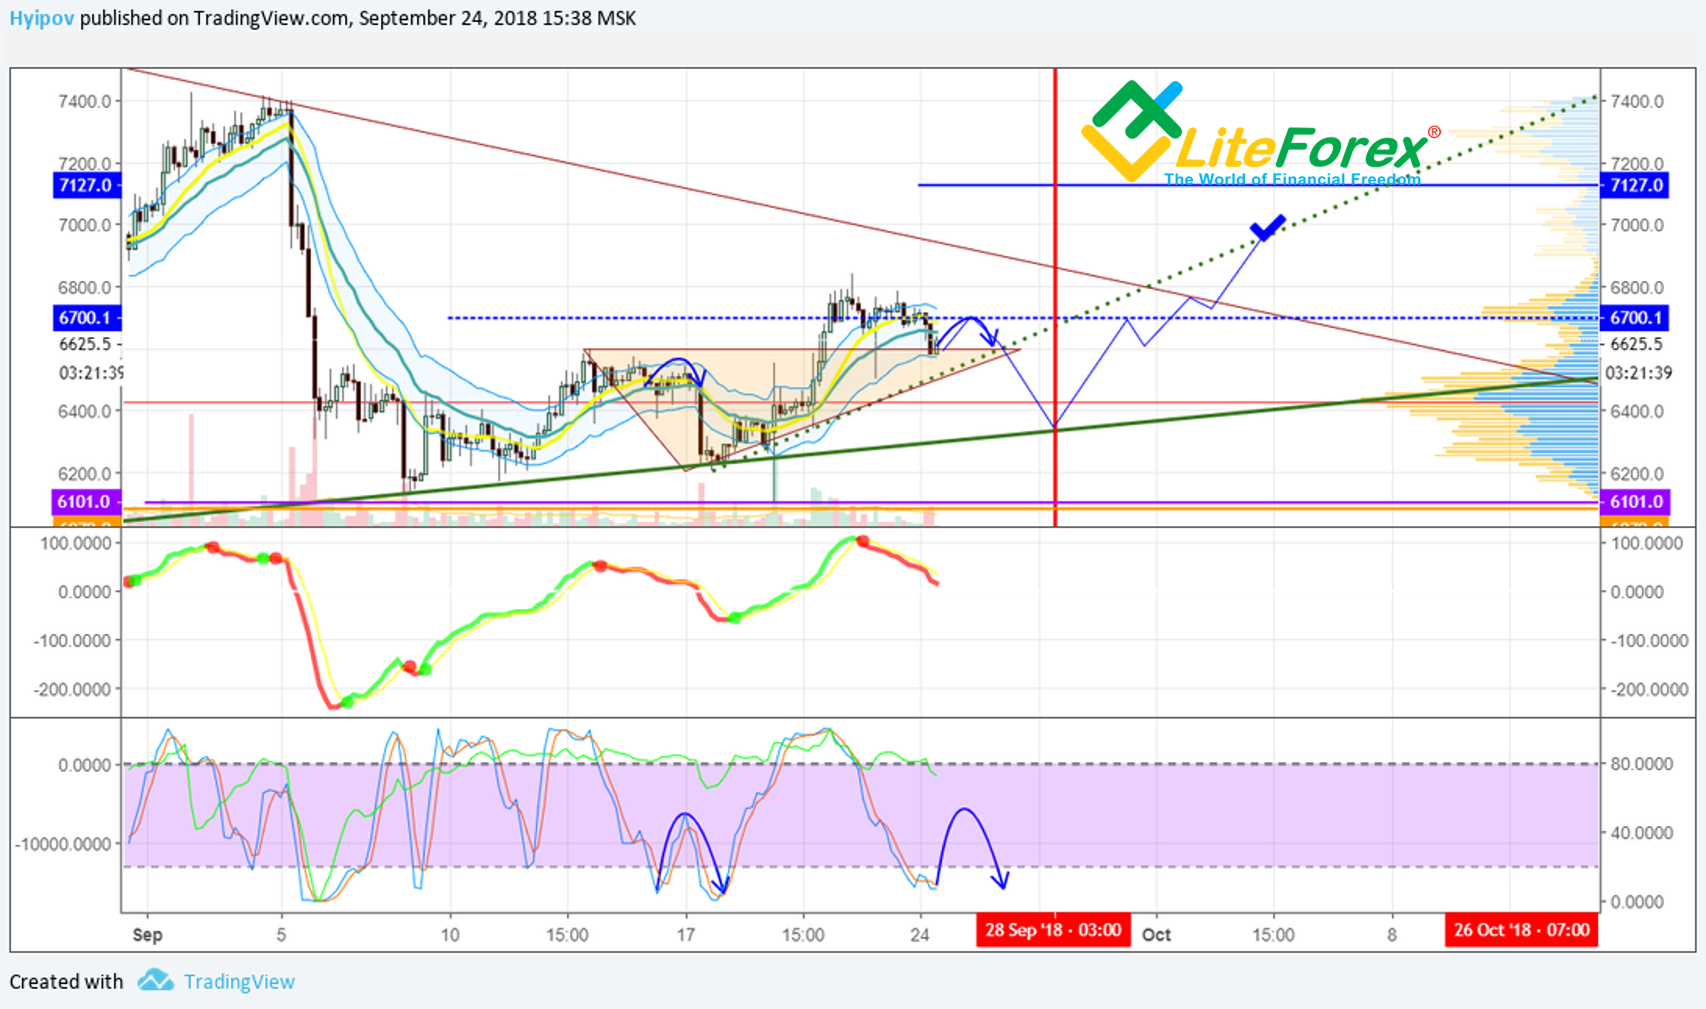
In the chart above, we see a possible repetition of the previous fractal, when the ticker failed to break through the key support level and only did it on the second attempt. Now the bears have to overcome the level of 6550, on which a large accumulation of longs is concentrated. This situation is deceptive, because the market has repeatedly shown that even the largest walls sometimes are not an obstacle, especially if the walls are built by a manipulator.
In my opinion, we have a clear luring of longists at the level at 6550 USD with their small limit orders around the seemingly insurmountable wall, however, such walls can vanish with a light push of a button. As a result, unhappy hamsters will face an unequal battle with hungry bears and will be torn to pieces. However, I do not expect a major fall. This is evidenced by a mass of support levels and our experimental price charts.
Judging by the total of the signs, the current bottom of the market is in the area of 6400 - 6300. And even in case of the most pessimistic development of events, we will not fall below 6100 even in case of a strong negative. We remember that the market is getting immunity to bad news!
