
BTC/USD analysis. Update on Bitcoin forecast for next week.
The following was used in this publication: Graphic analysis, trend analysis, Japanese candlestick analysis, frontal volume analysis, Gann levels.
Here’s our regular forecast for the BTC/USD pair. Last week, there wasn’t any serious news that could somehow affect the market dynamics. To be fair, the collapse below 6,000 USD wasn’t accompanied by any fundamental events either, so the return of Bitcoin to the previous resistance level may be expected with no informational reasons as well. I think one of the most remarkable events is Bloomberg’s confirmation that Tether was really backed by the currency at the end of January 2018. Even though Bloomberg isn’t an auditor and this information may be false. However, this event is exclusively positive in every way.
Remember the collapse that started in late 2017 and gave rise to a bearish trend. For those who might have forgotten: the collapse was caused exactly by speculations amidst rumours about Tether’s scam. At that time, Tether had problems with the auditor and the connection between Tether and Bitfinex was revealed. The idea itself of Tether issuance without any backing for propping up Bitcoin had already become an axiom that didn’t require proof.
So, if Bloomberg doesn’t lie, the reason for a collapse is a mere fake. It becomes evident that the whole cryptocurrency market has become hostage to the manipulator who found a hot button and pressed it at the right time. As a result, the collapse we see now is groundless and the whole crypto-market looks oversold and attractive for the investor.
On the other hand, if we suppose that Bloomberg is lying and Tether wasn’t backed, it means the whales may want to stop the bearish market.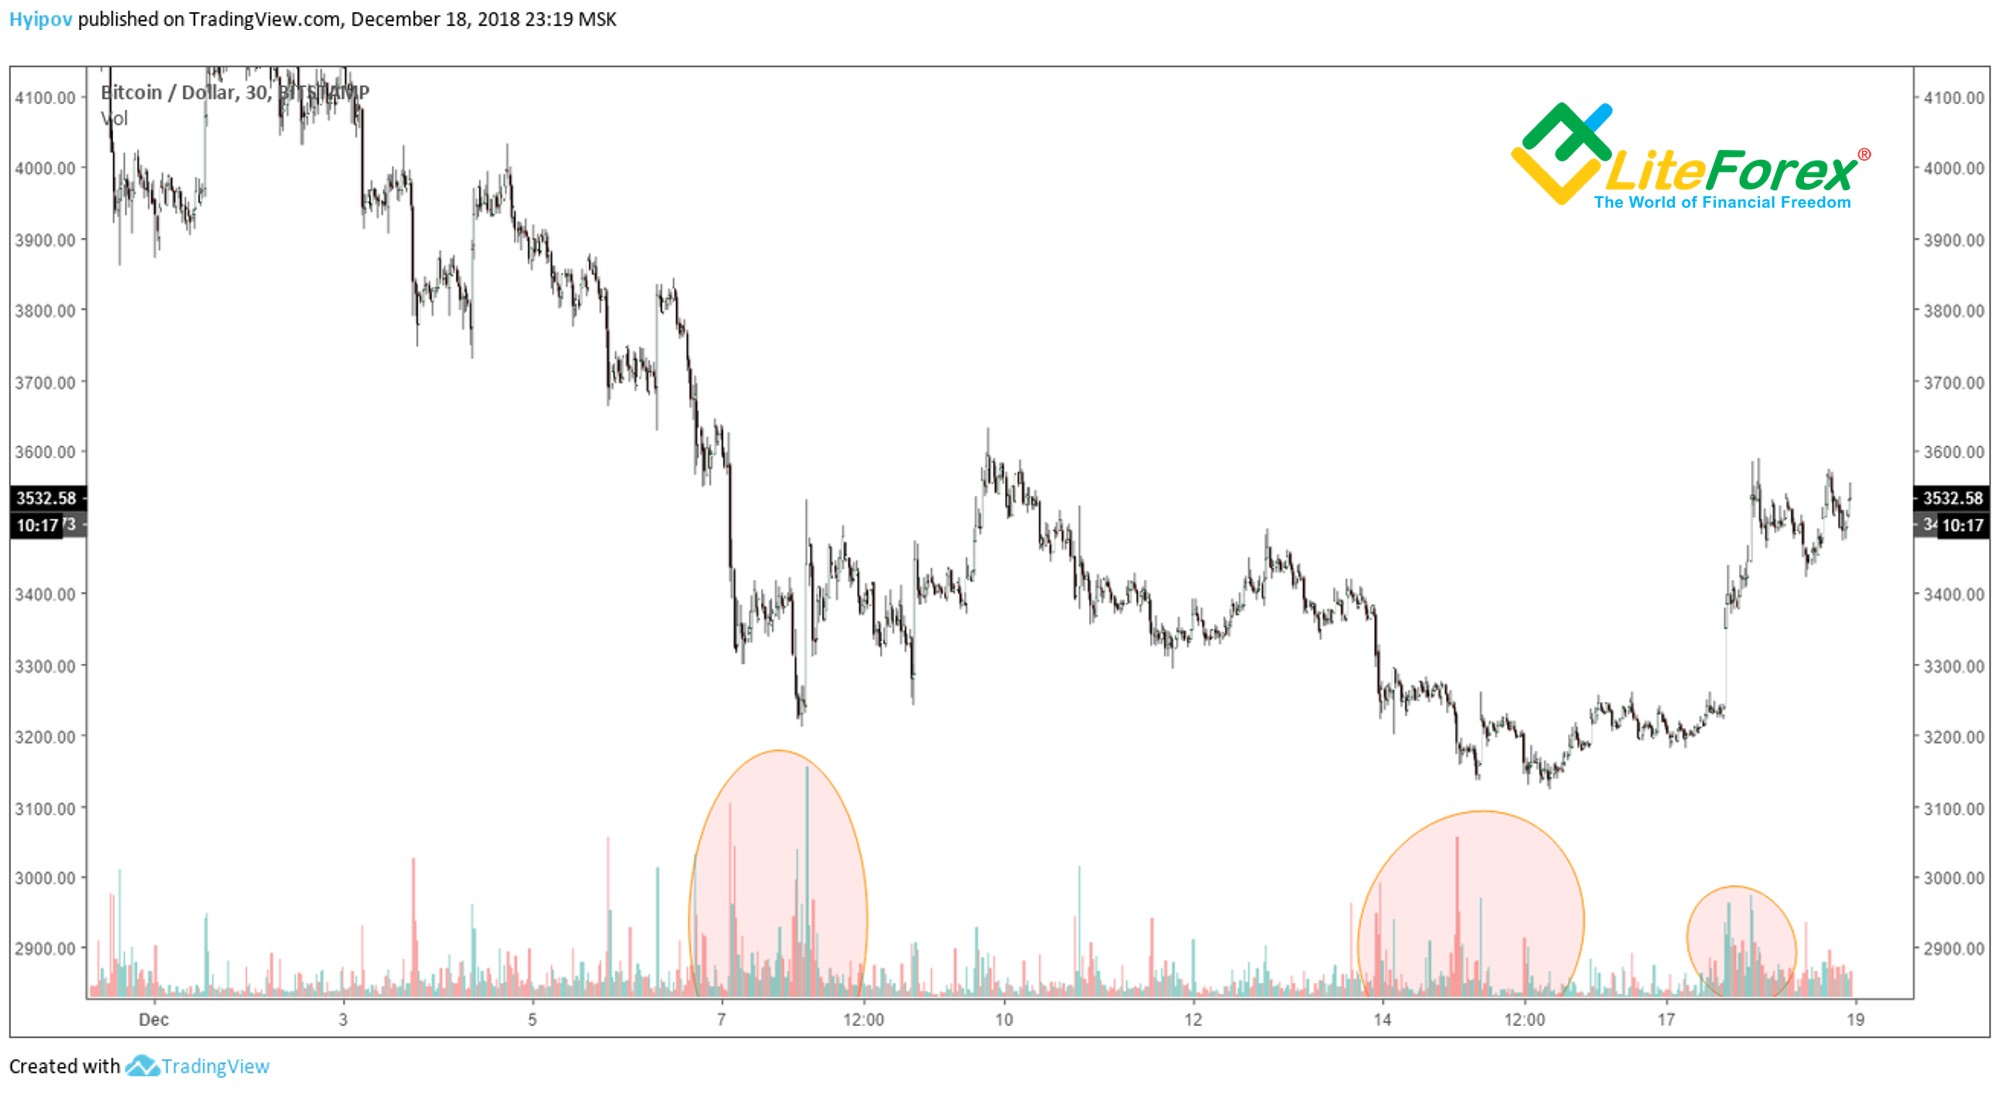
The one-minute charts show that Bitcoin large buyouts became more frequent amidst generally low trade volumes. In general, we may conclude that the manipulator has bought up enough and is now protecting its position, trying to stop correction and reverse the market with such buyouts.
To understand if the market will manage to reverse, let’s do some technical analysis.
Technical analysis
First, have a look at the previous analysis.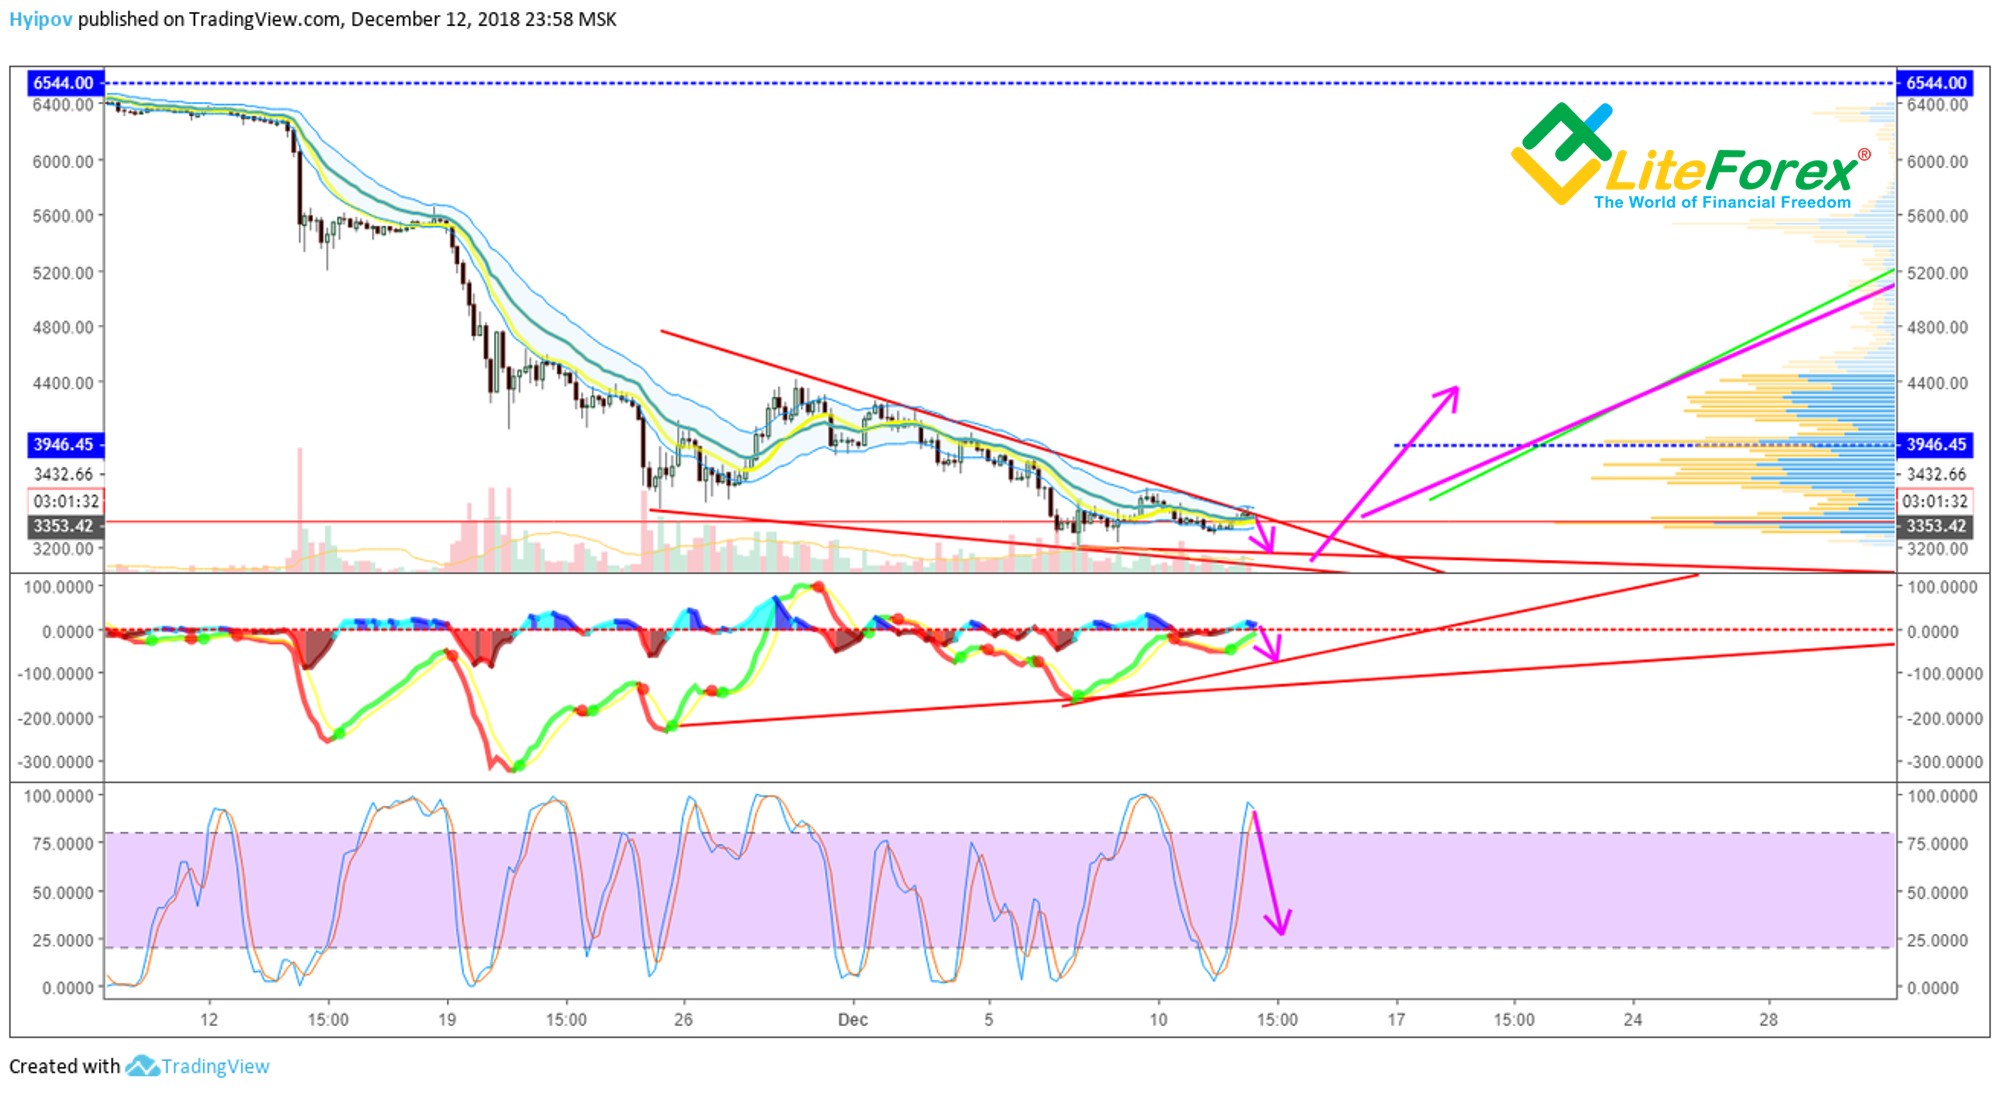
I conjectured the formation of a downward wedge with a forthcoming breakout in the H4 chart above. Bullish convergence was missing for going up, that’s why the fall of the ticker with the retest of the bottom was predictable.
As the history proved it, the idea hit the bull’s eye. With extremely high precision.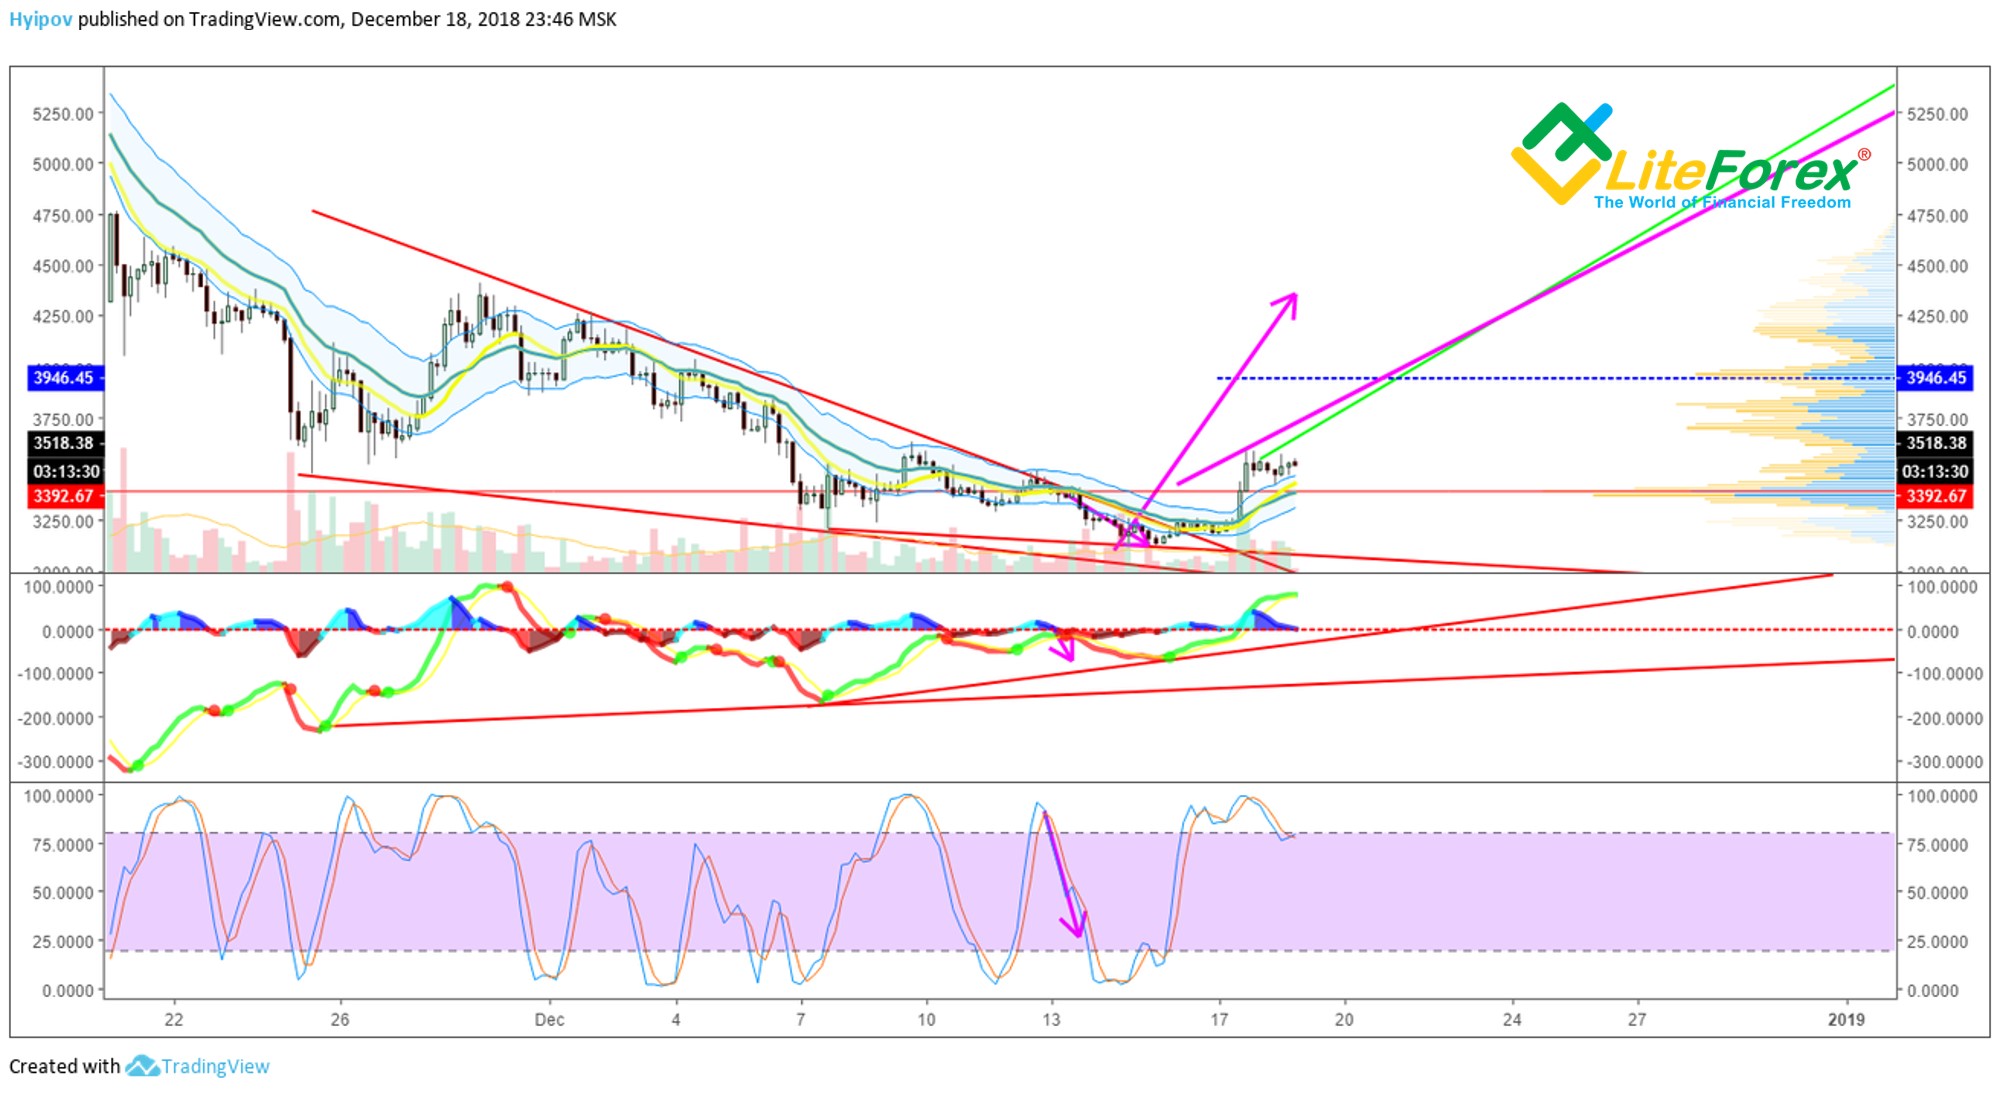
The Bitcoin ticker updated the low at 3,122 USD, thus forming the convergence that completed the general reversal pattern formed on the daily time frame. After that, a breakout didn’t keep us waiting.
The ticker almost reached a level of 4,000 USD! What will happen to the Bitcoin next?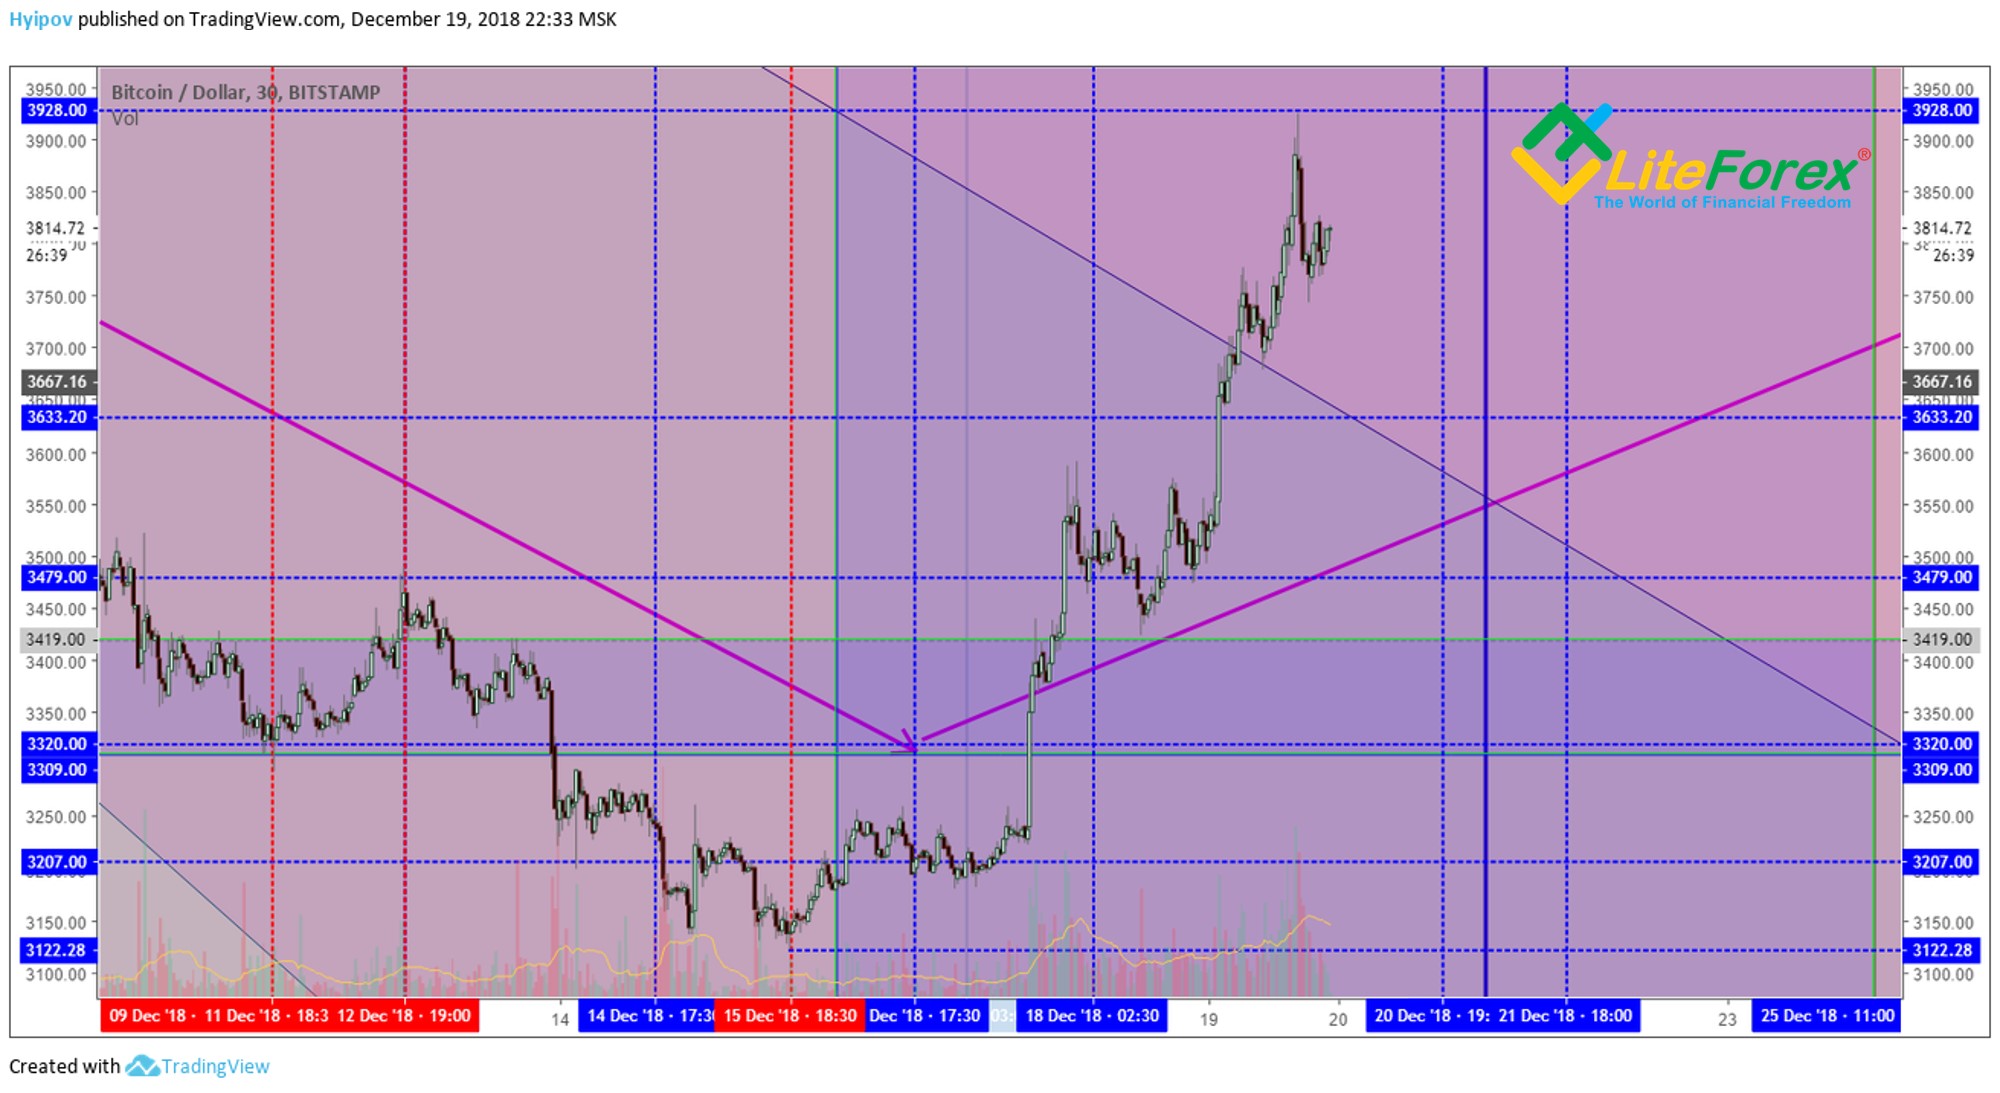
As we can see in the chart above, Gann level at 3928 USD worked with extremely high precision. A weekly level (20 December, 7 pm UTC+3) is approaching.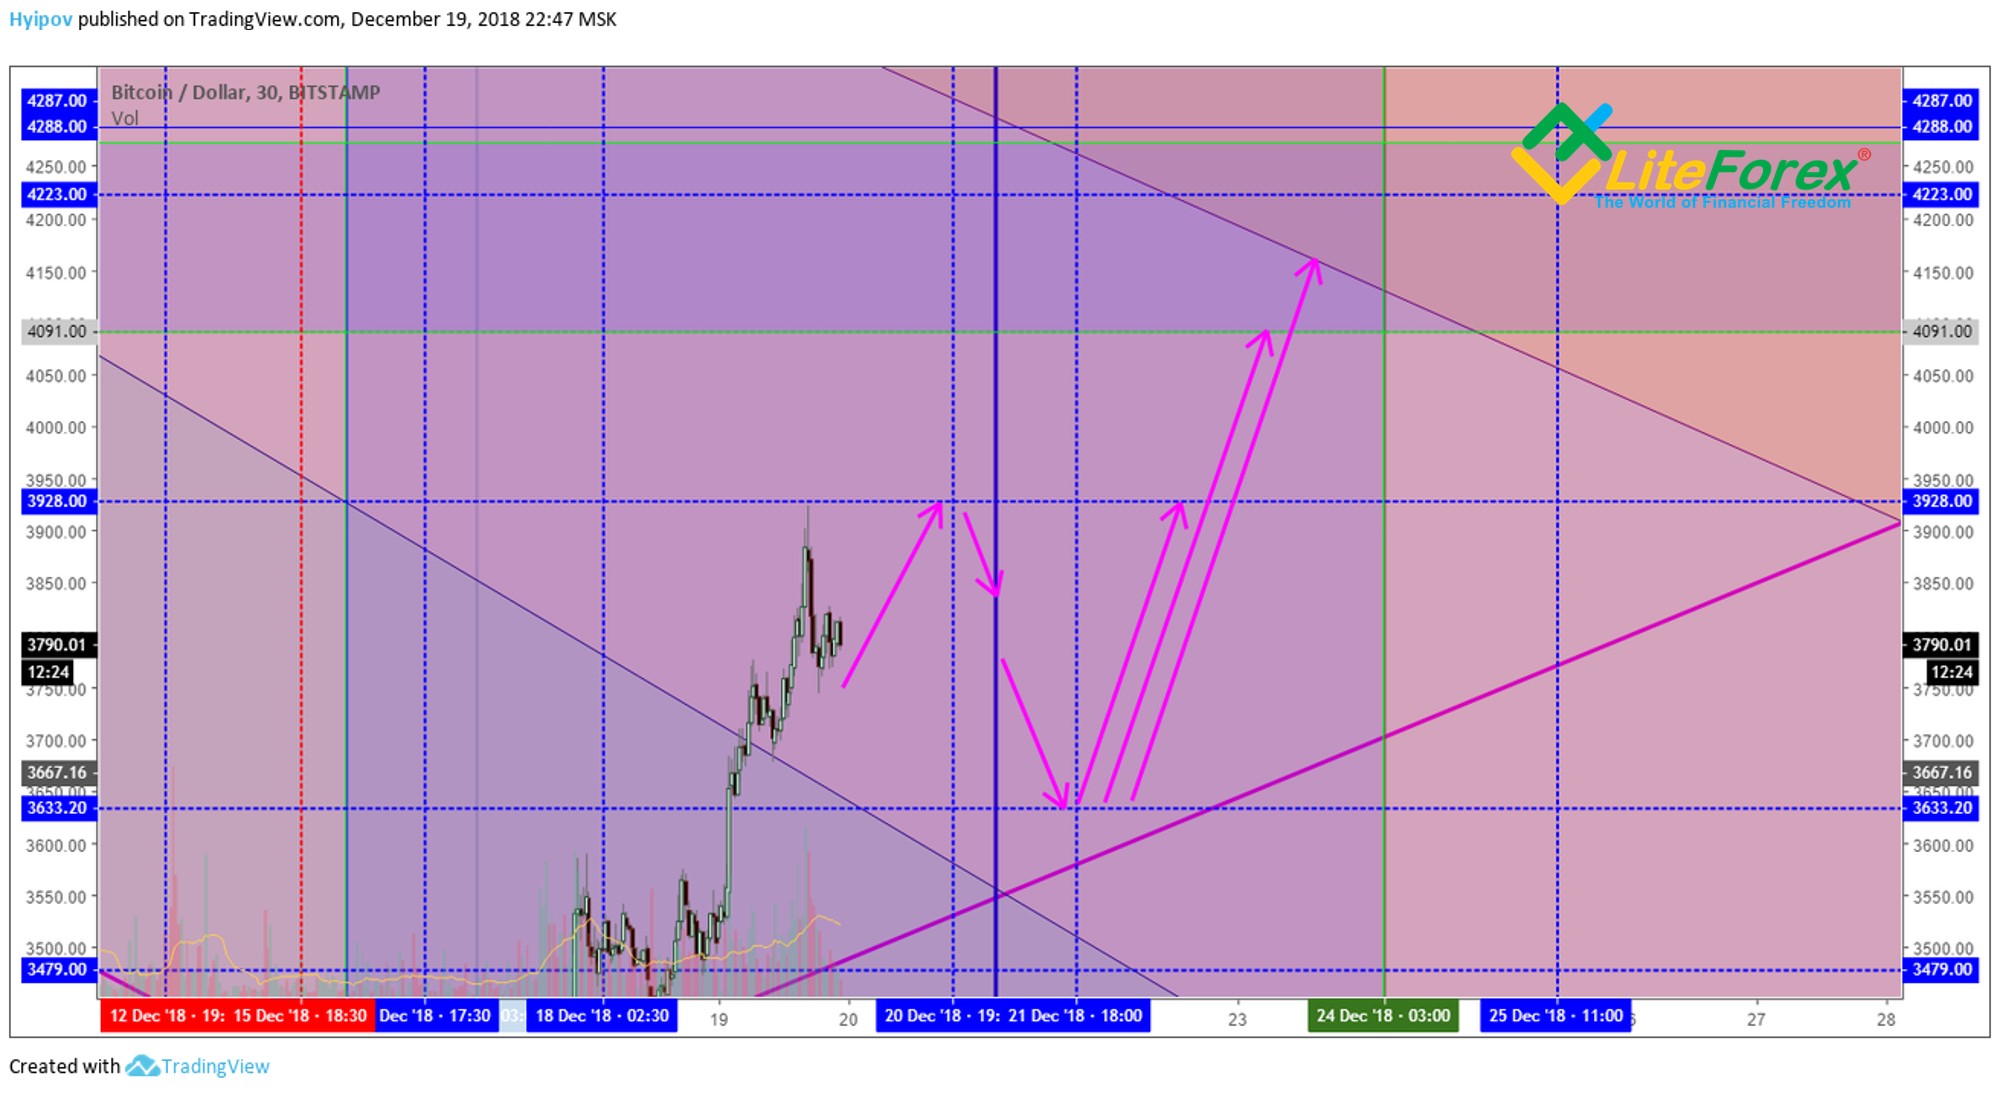
What’s more, according to the solar calendar, a new stage of solstice comes on 21 December, and it’s a reason for recalculating global levels in a future forecast. A change of solar phases means a new phase of the market development which can put an end to the bearish trend and start a flat. As this line is surrounded by lots of Gann weekly levels, we are most likely to see increased volatility with an attempt to exceed the level of 4,000 USD.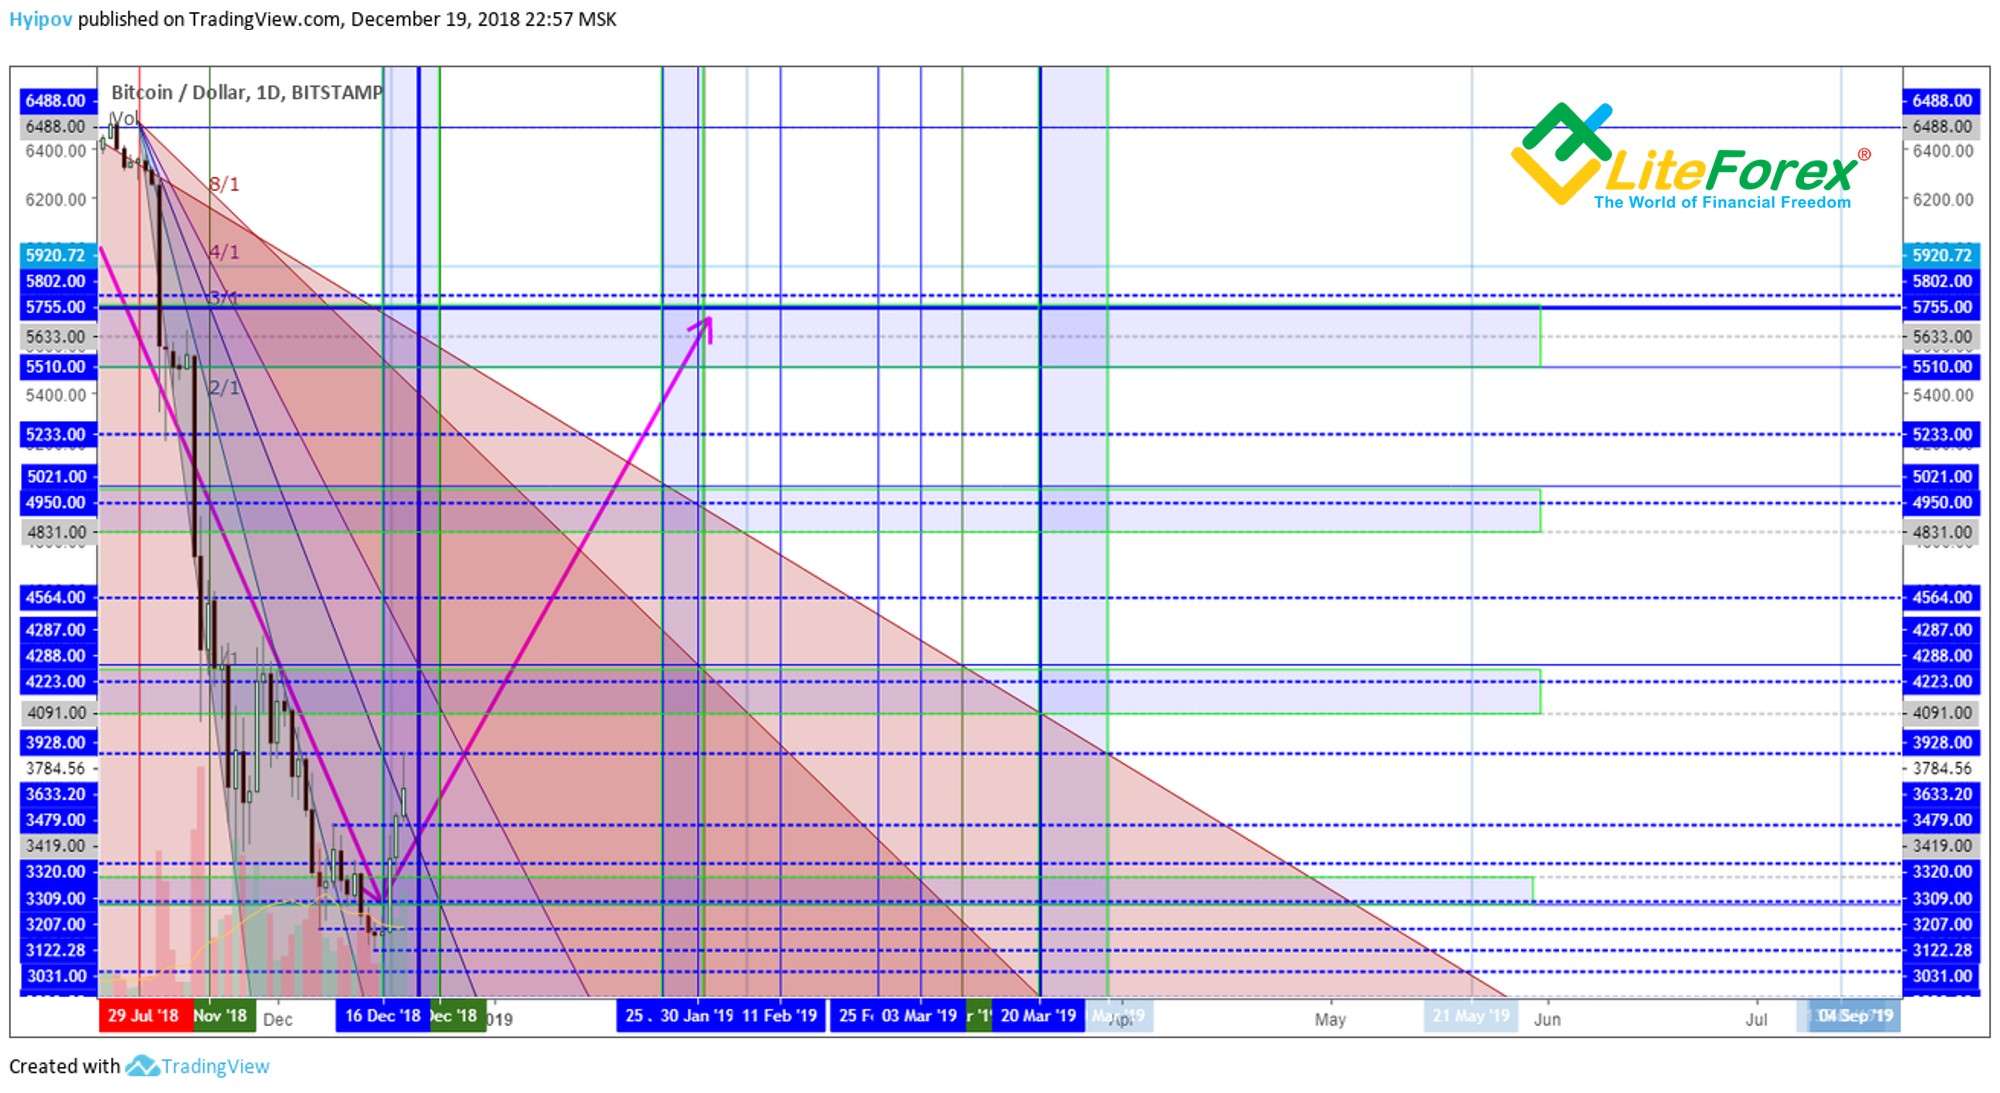
However, the accumulation of Gann price levels lets us think that this increase will stumble over the nearest resistance zone around 4,100 – 4,300 USD and a further movement will hardly be possible without correction.
Let’s look at solar phases one more time.
In the chart above, I’ve marked the bounds of solar phases in blue. As we can see, each segment marks a special market state different from the previous one. These phases help easily trace the life cycle of both ascending and descending trends. The last phase between 23 September and 21 December was marked with a powerful collapse in its second part. As a result, we shouldn’t expect the same of the next phase. We see that the trend is moving gently from one phase to another, so we shouldn't expect growth in the next phase. Most probably, the next solar phase will be reflected in the market’s soft drawdown to the bottom or in the development of a sideways movement with a moderate range of 3,000 – 5,000 USD.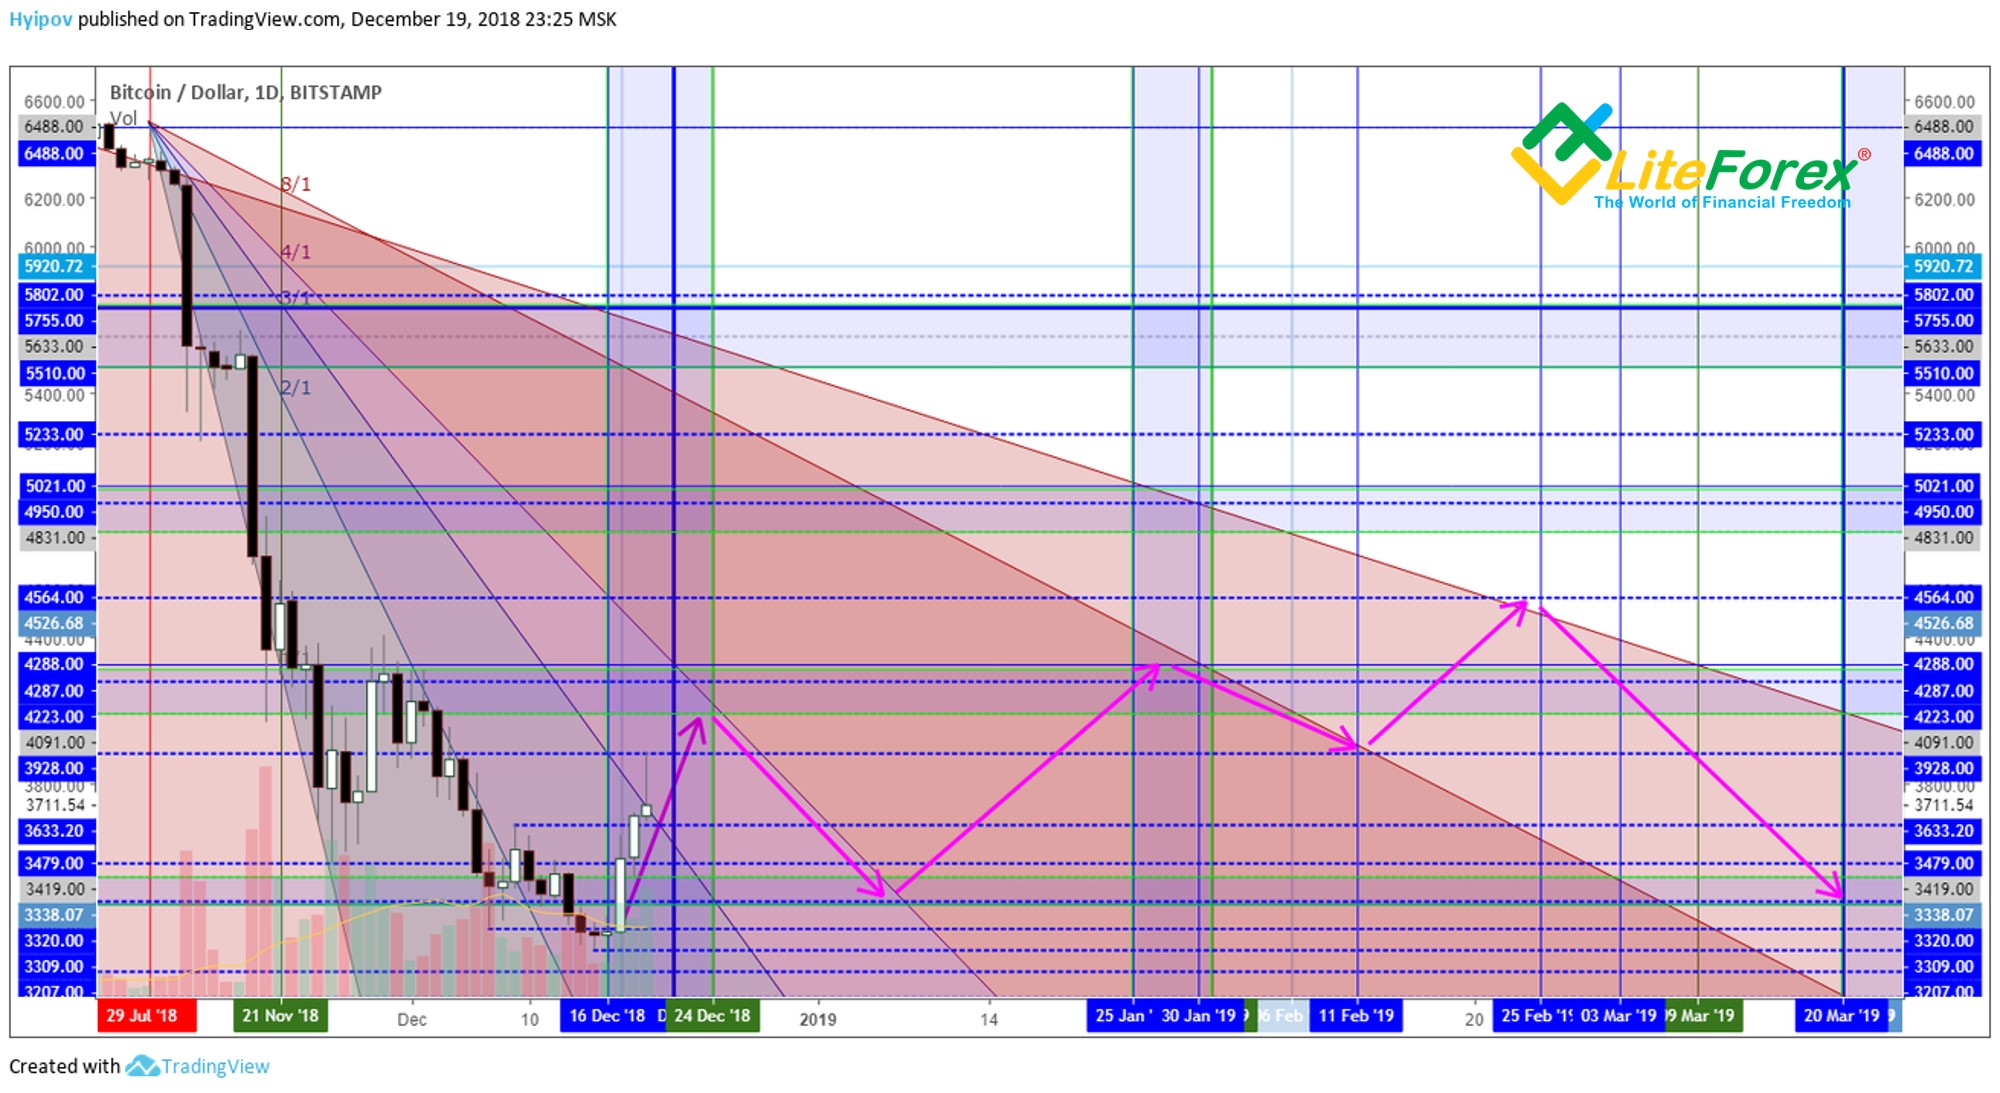
Using Gann angles and the Gann grid, I showed one of the probable scenarios in the chart above. We will understand if the market will be moving in this or another way once we’ve conducted technical analysis.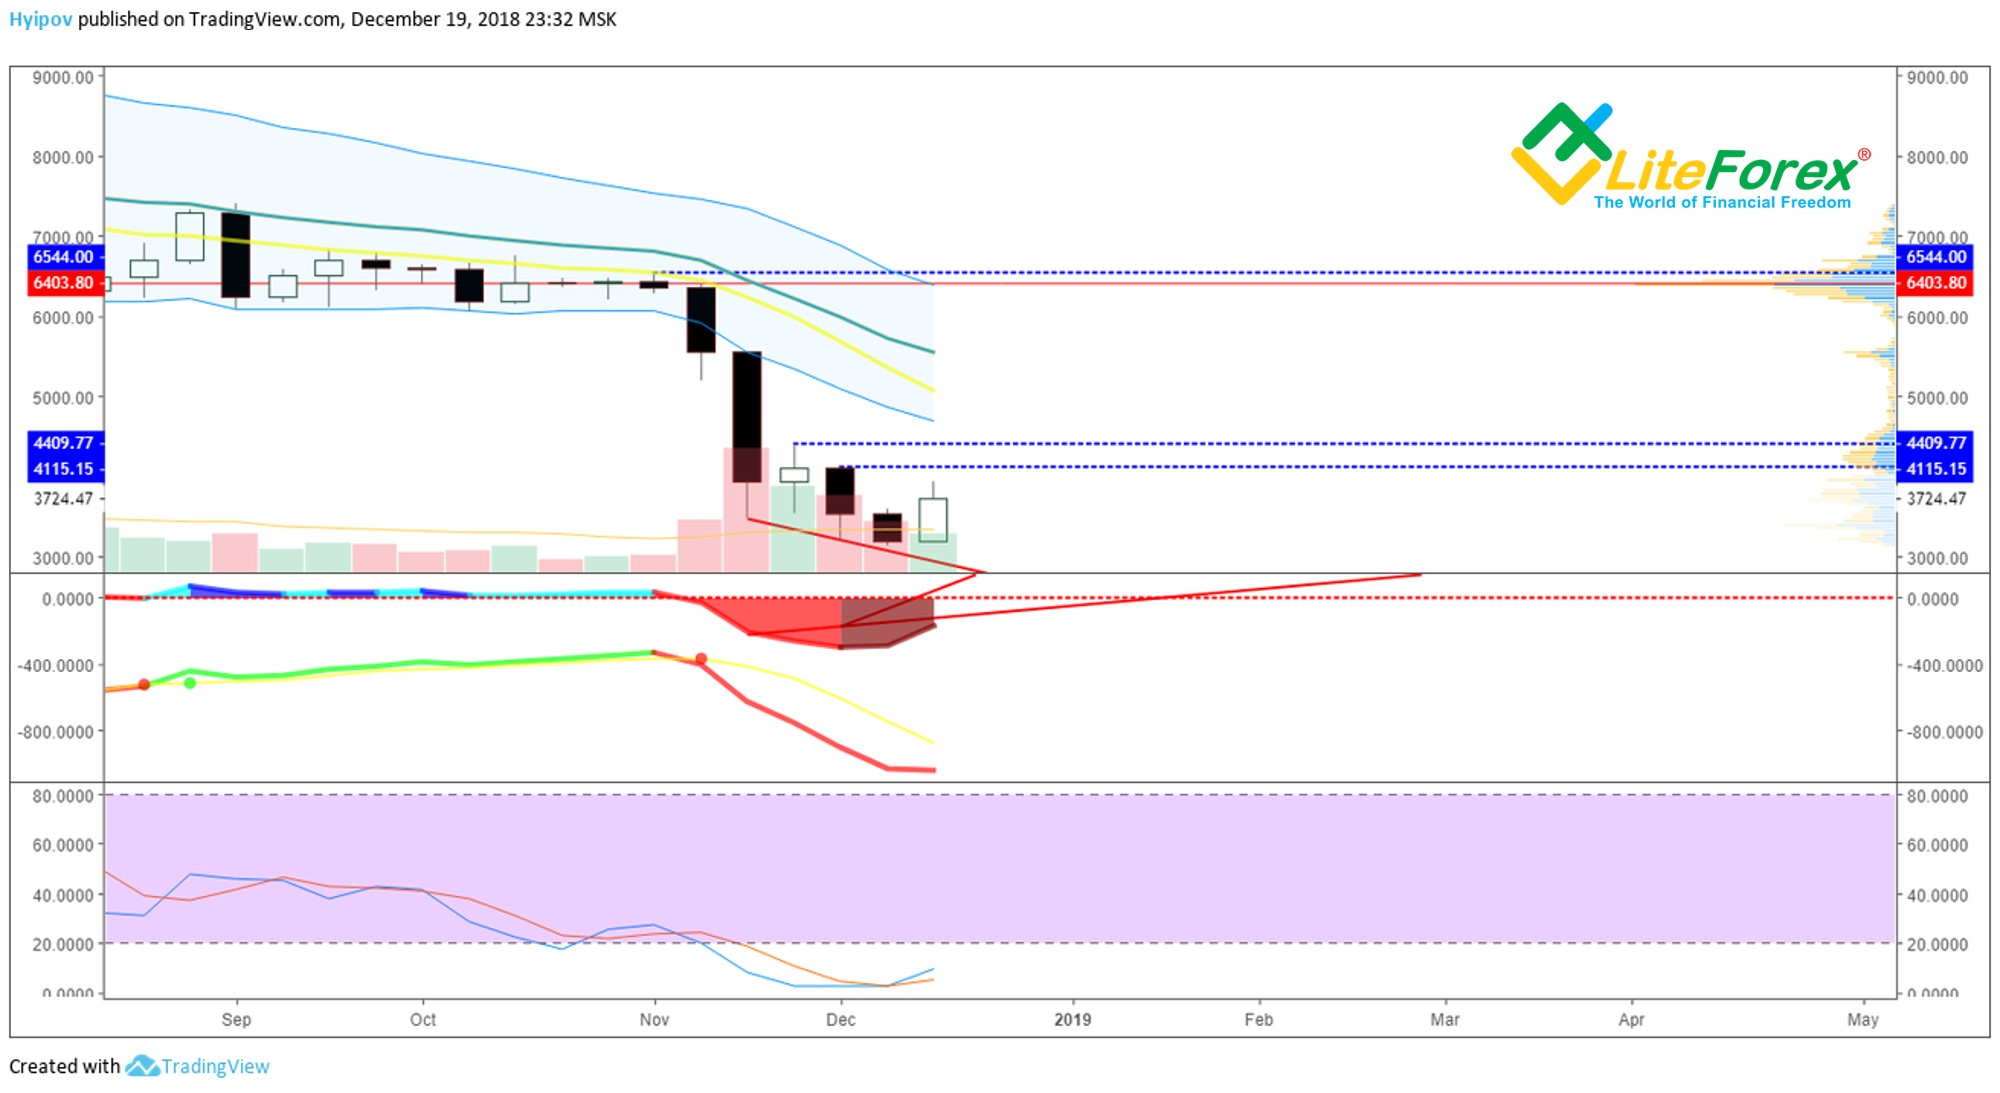
Let’s look at the weekly chart above. Even though the last candle isn’t closed, it produces a bullish signal of the continuation of the bullish correction owing to a steady breakout of the previous candle. Provided that the continuation of the current candle breaks the level of 4,115 USD and doesn’t fall below 3,700 USD.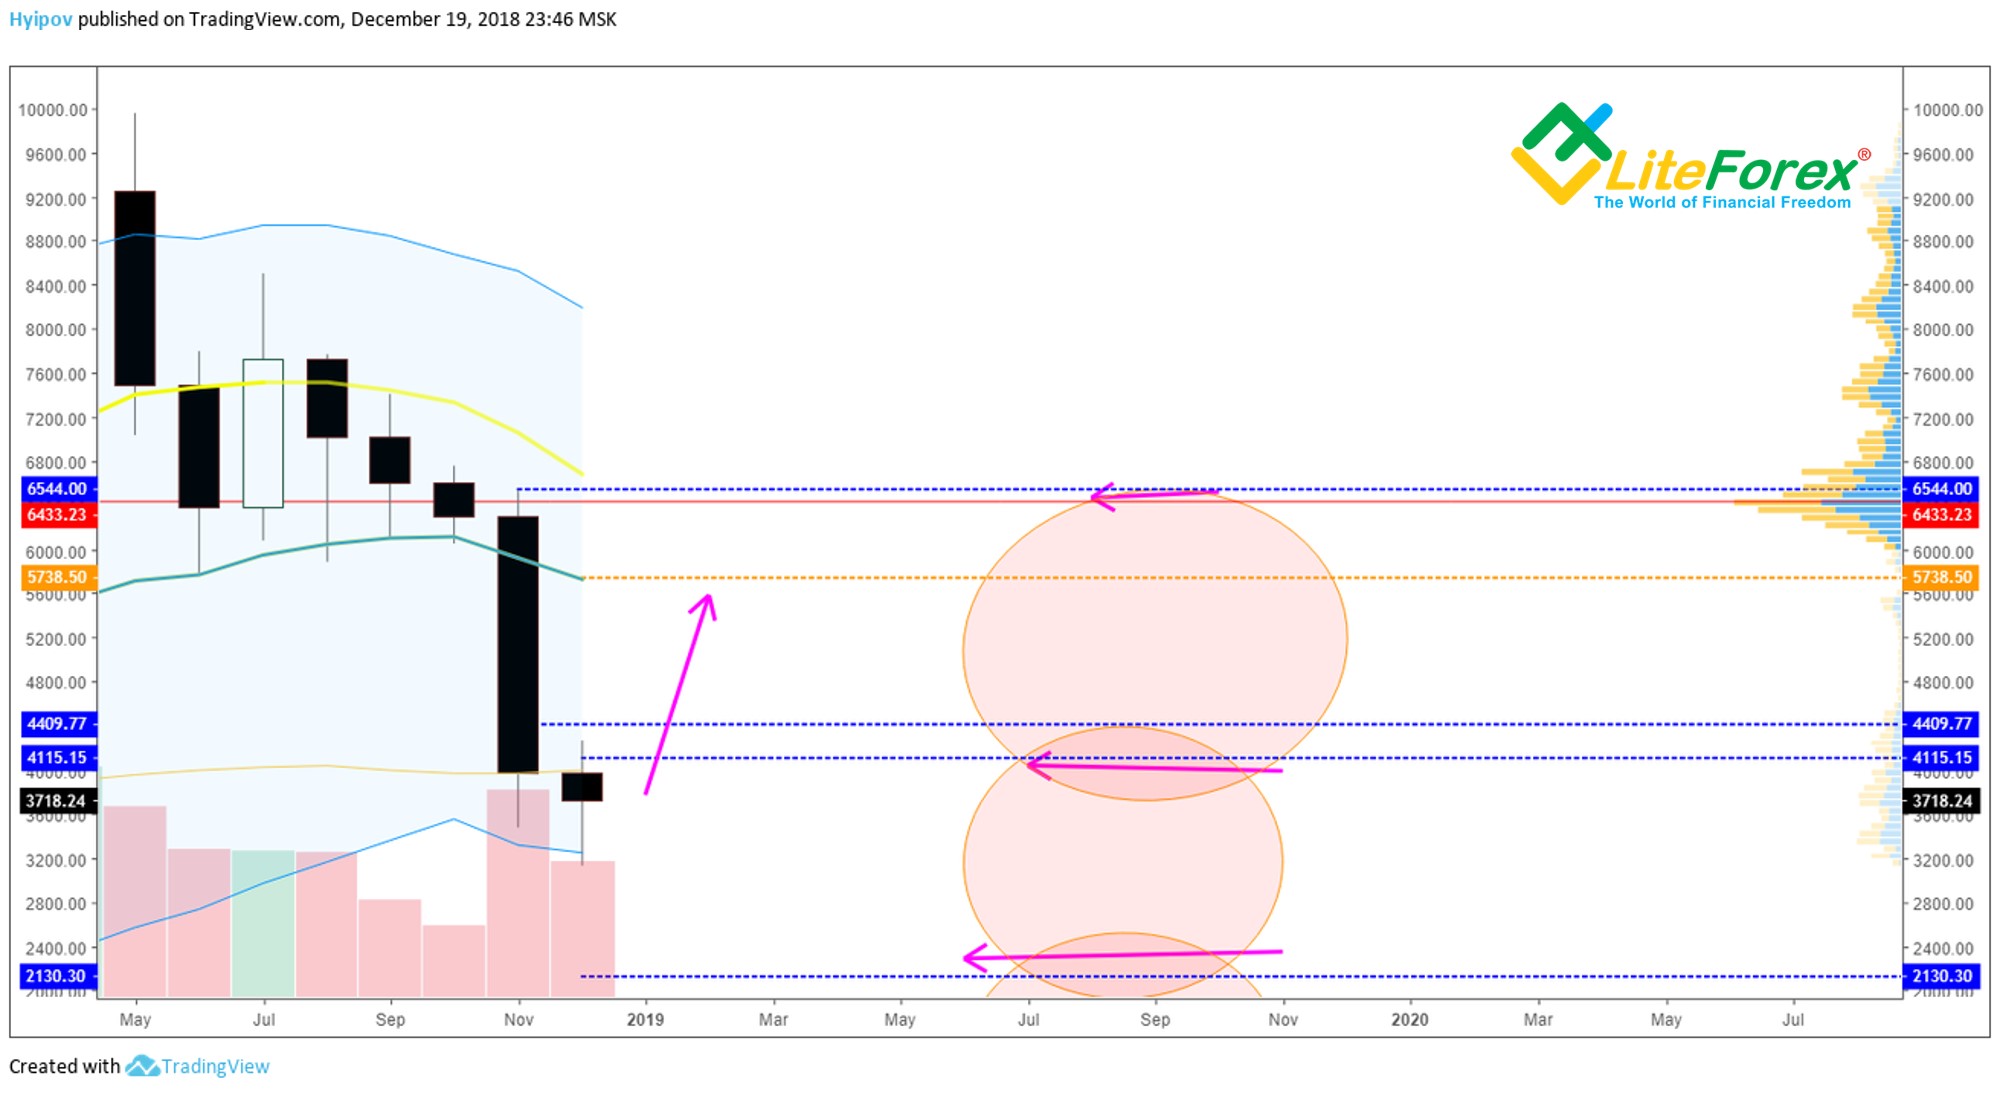
If that’s the case, December’s equilateral doji will appear in the M1 chart. It will allow us to count on January’s growth to the target of 5,700 USD, where the middle Keltner level will be waiting for us.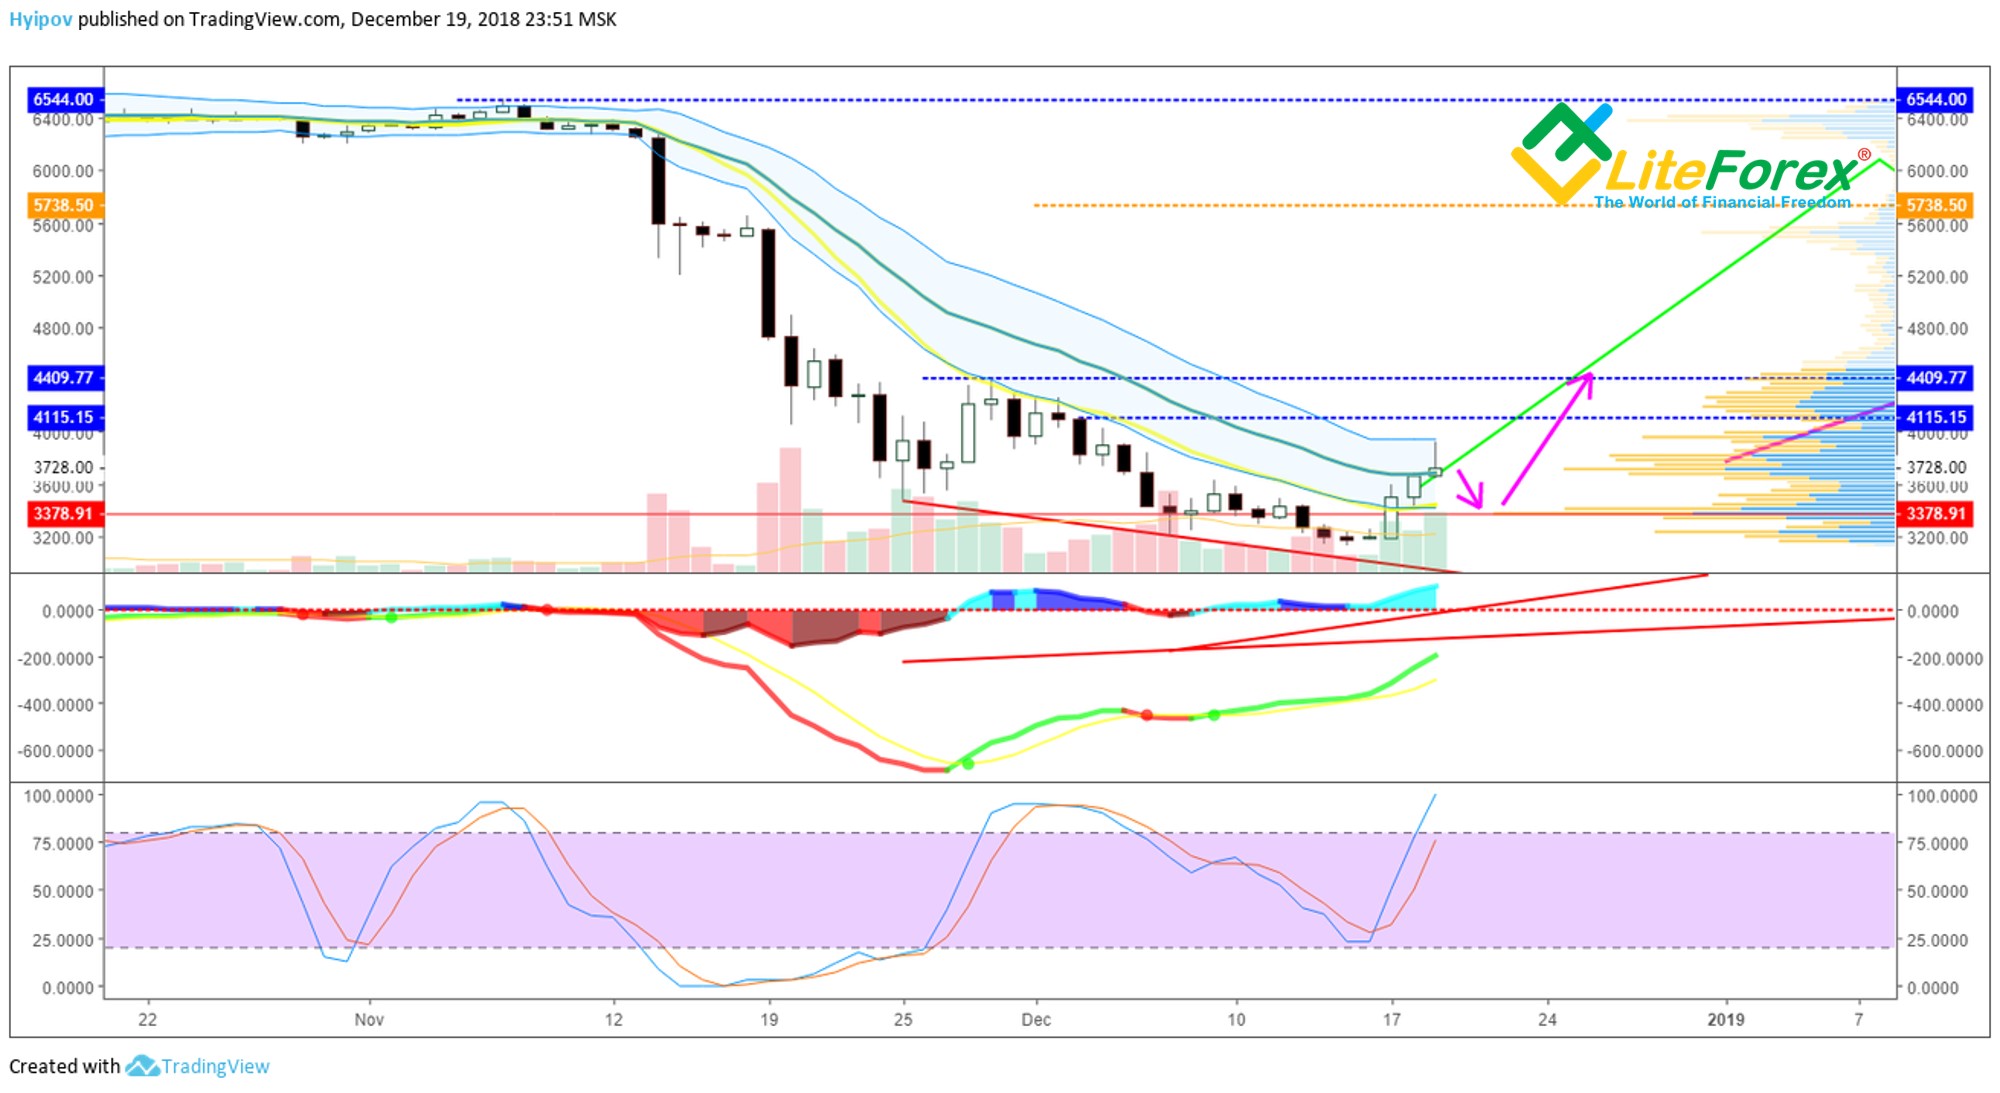
The daily chart doesn’t provide any downward signals. The ticker touched the upper border of the Keltner channel and a logical retracement followed afterwards. Oscillators haven’t predicted any falls on this time-frame yet, that’s why a downward correction, if it happens at all, will be local and will hardly exceed the limit of 3,378 USD. If all happens in this way, the market will find a new lease of life and we will see new local maximums tested next week, first at 4,115,then at 4,409 USD.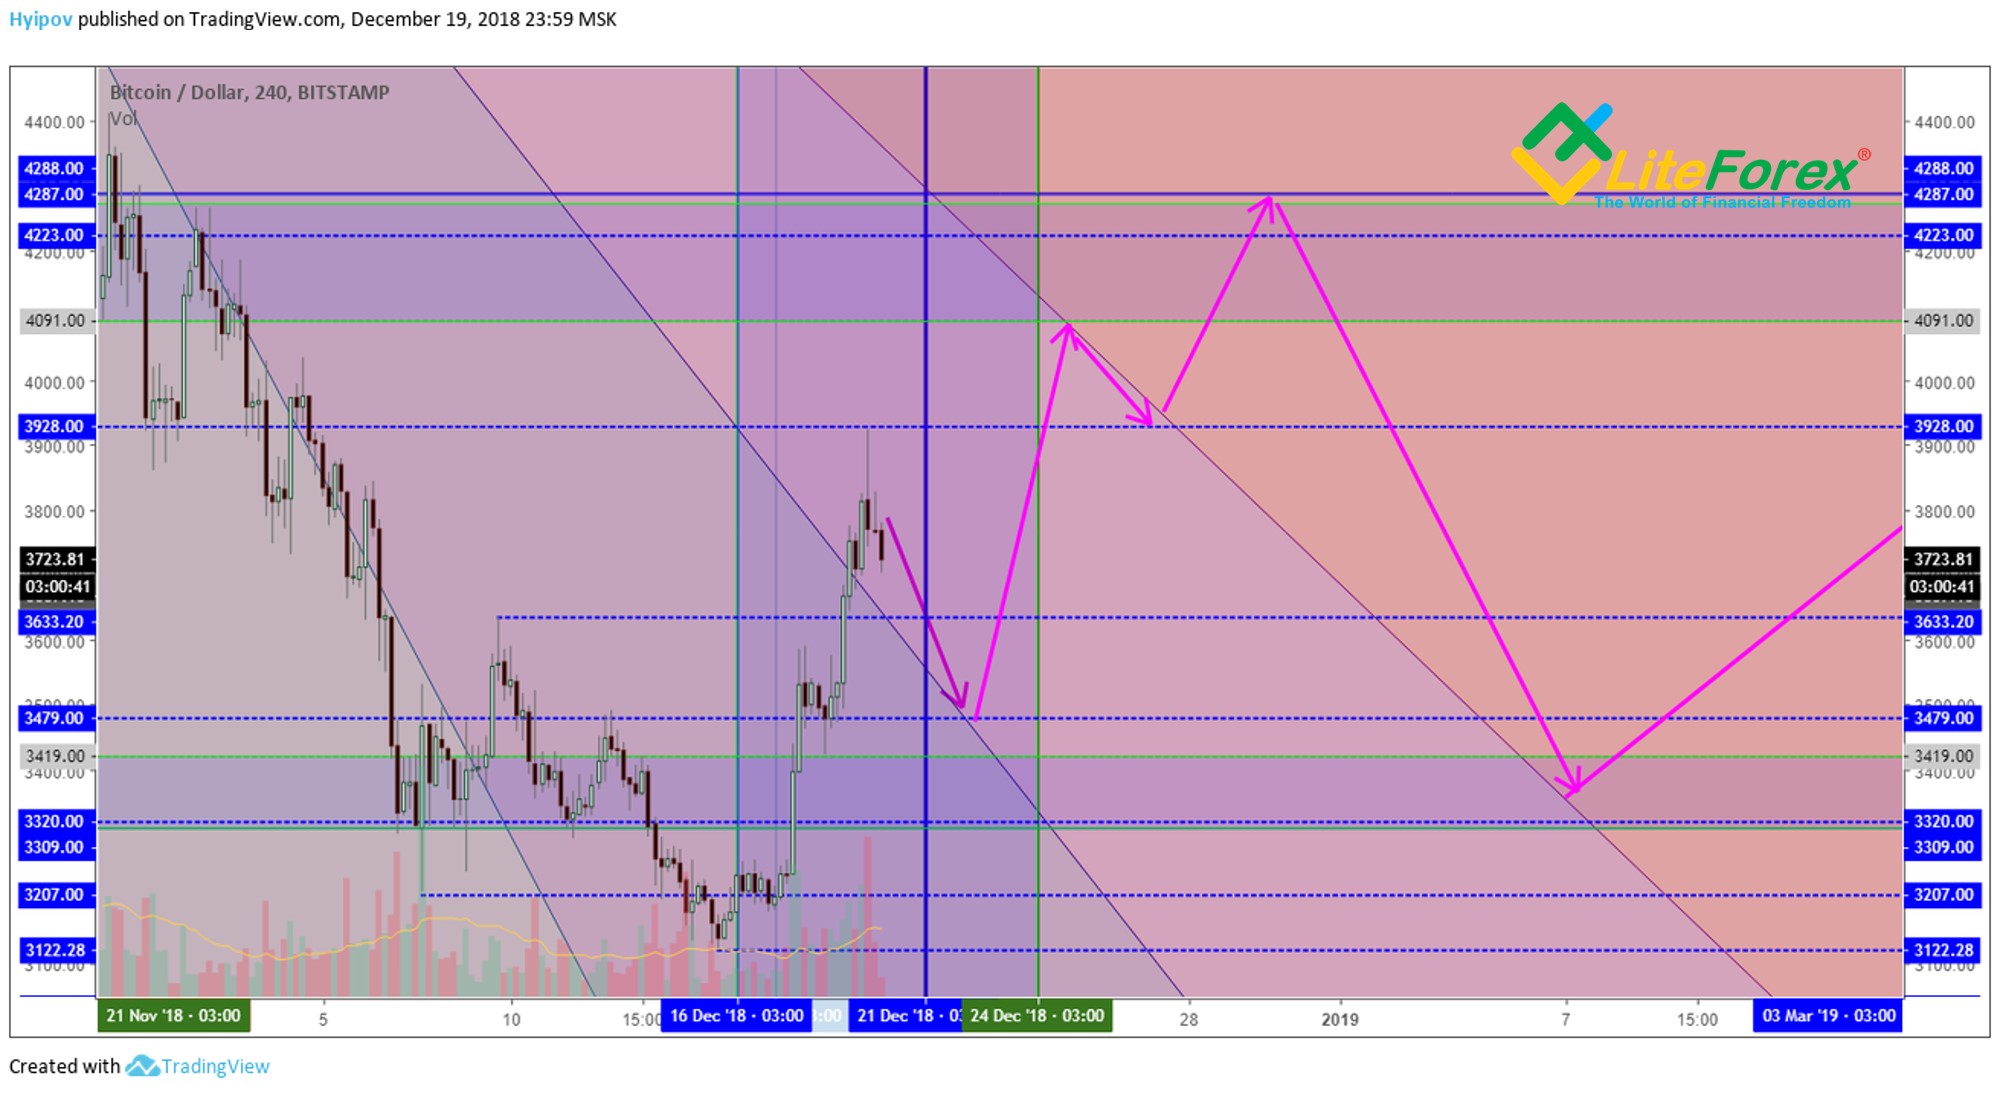
Applying this scenario to Gann level and the dates from Gann net, we’ll have quite an optimistic scenario in the chart above. It allows us to hope for additional buyouts around 3,300 – 3,400 and to fix profits around 4,100 – 4,300 USD.