
Updated BTC/USD forecast and Bitcoin analysis for the next week
In this post I applied the following tools: fundamental analysis, all-round market view, market balance level, volume profile, graphic analysis, trendline analysis, the Kagi chart, the Tic-Tac-Toe chart
Dear friends,
The new week has started. As it is usual on Monday, I’ll sum up the Bitcoin results and update by forecast for the BTC/USD pair for the next few weeks.
But first, let’s compare the current BTC state and the previous BTC/USD forecast.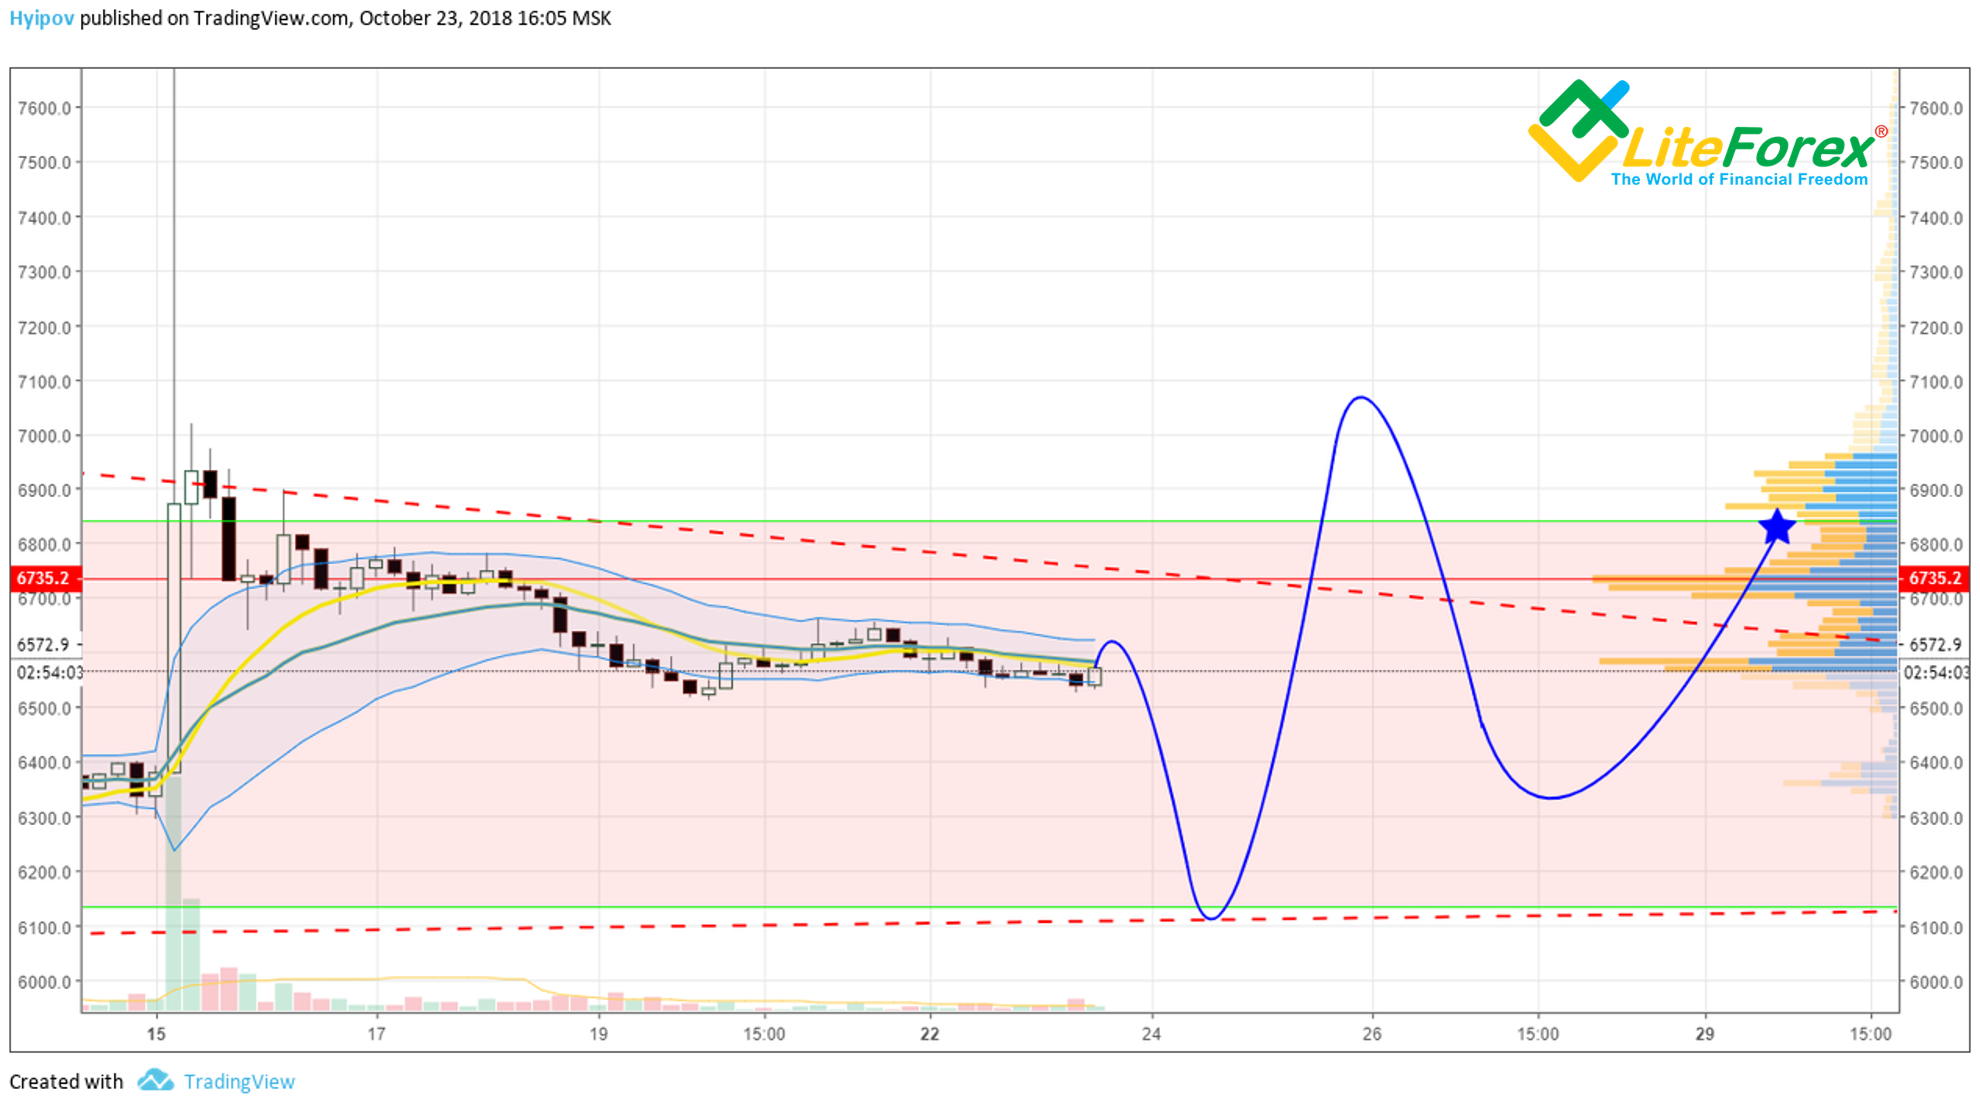 (BTC/USD scenario, dated 23.10.2018)
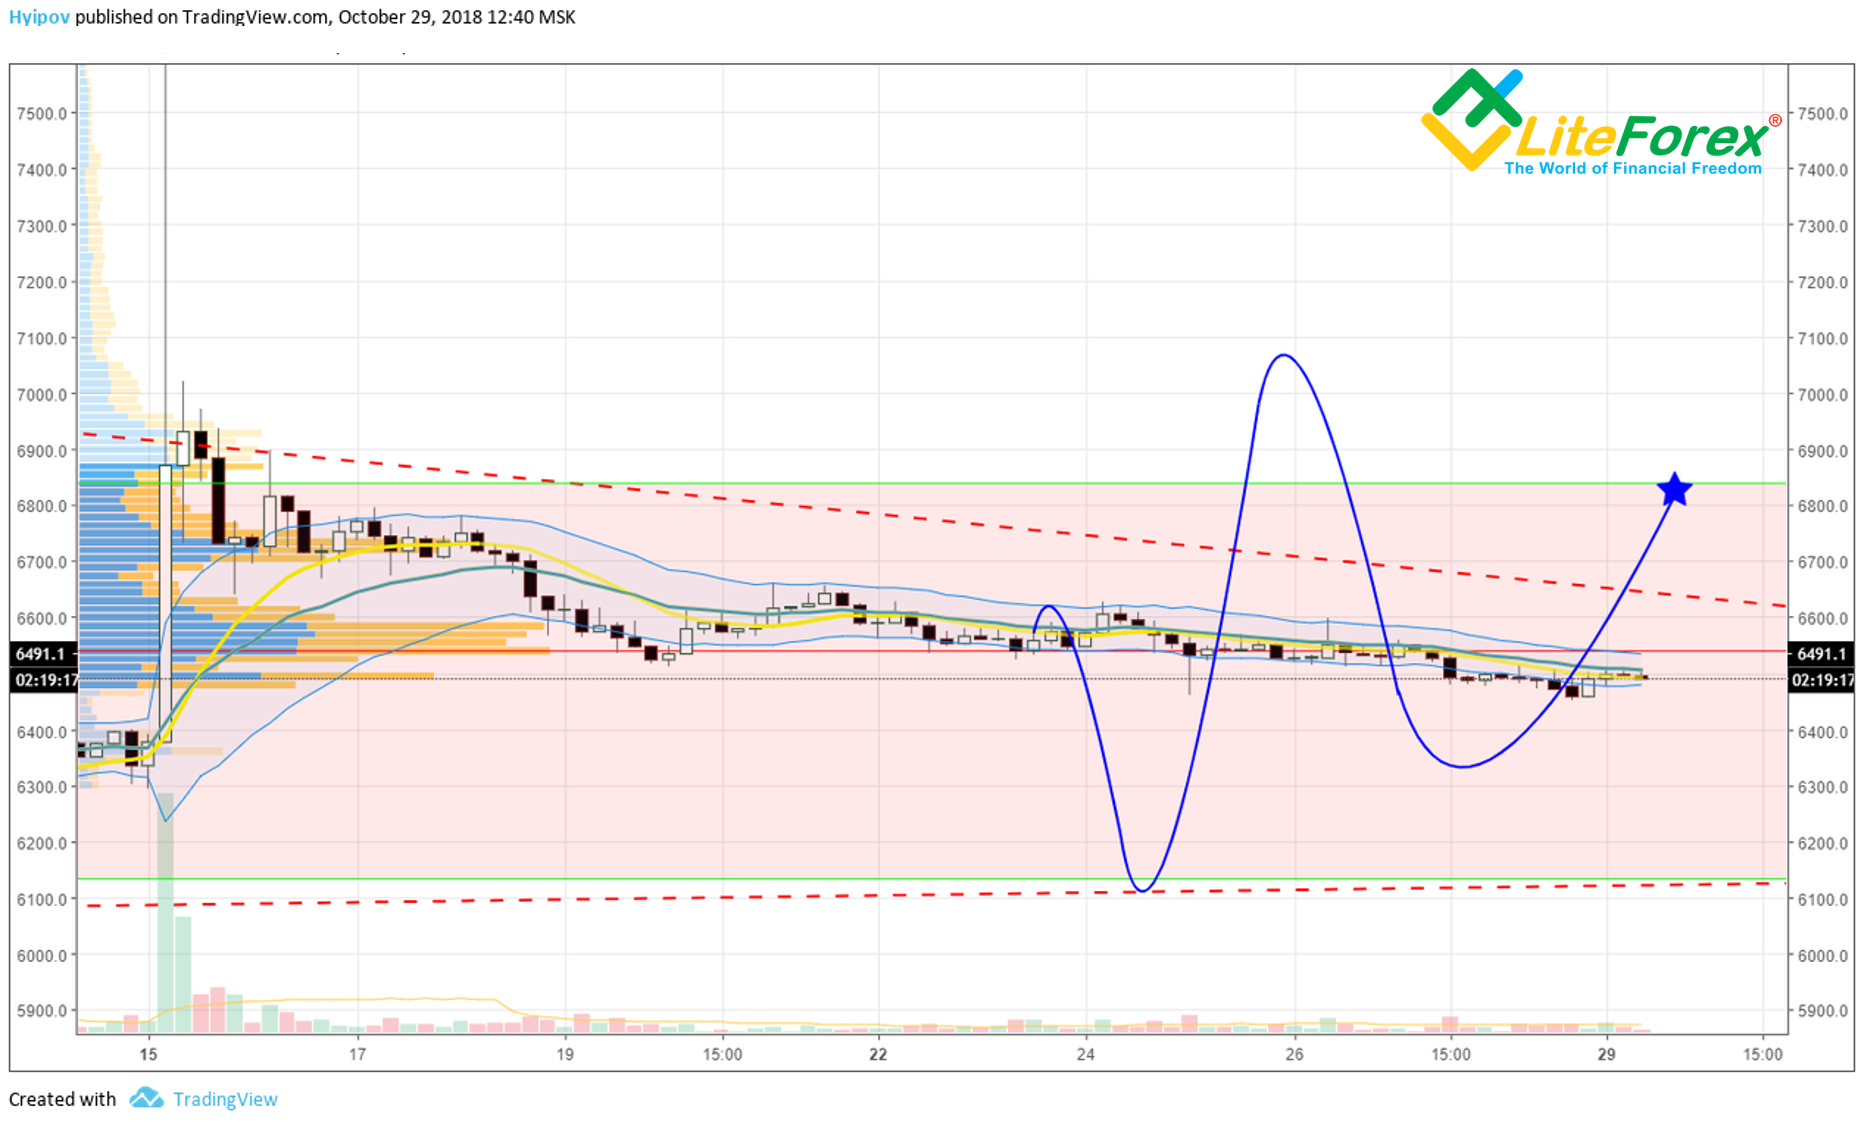 (BTC/USD current situation as of 29.10.2018)
As it is clear from the two charts above, the BTC/USD ticker, despite all the expectations, continues trading flat. The volatility of the BTC/USD instrument has been down to its record low of 2018, being less than that in the stock market.
How long will the flat in the crypto market go on?
I suggest fundamental analysis to find out.
Bitcoin fundamental analysis
23.10.2018 – Coinbase was approved by New Your State Department of Financial Services as a cryptocurrency Custody Trust Company. For those, who are not familiar, this news bit is not that significant; but, basically, it is a big step in the crypto industry development. In fact, Coinbase has received the formal approval for bank services in the crypto market. Now, Coinbase has the full financial responsibility for storing the assets to not only the holder of these assets, but the responsibility to the State as well. On the other hand, all users, having their assets on Coinbase, will be legally protected, which is a great benefit for large and institutional investors.
On the same day, it became known that the Bakkt platform will be launched by the New York Stock Exchange parent company on 12.12.2018. The exchange doesn’t conceal that the platform is designed for large institutional investors.
24.10.2018 - VanEck and SolidX, which filed an application to launch Bitcoin ETF trading, announced that all flaws, stated by the SEC, had been eliminated.
26.10.2018. The Shenzhen Court of International Arbitration ruled cryptocurrencies must be legally protected as a property with “economic values.” So the China’s authorities officially recognized bitcoin trading and stated the regulation for this.
Therefore, there is no news, suggesting negative fundamentally. On the contrary, there is quite a lot of positive information about the progress in the crypto market regulations and soon capital inflows from institutional investors, State and pension funds.
BTC/USD technical analysis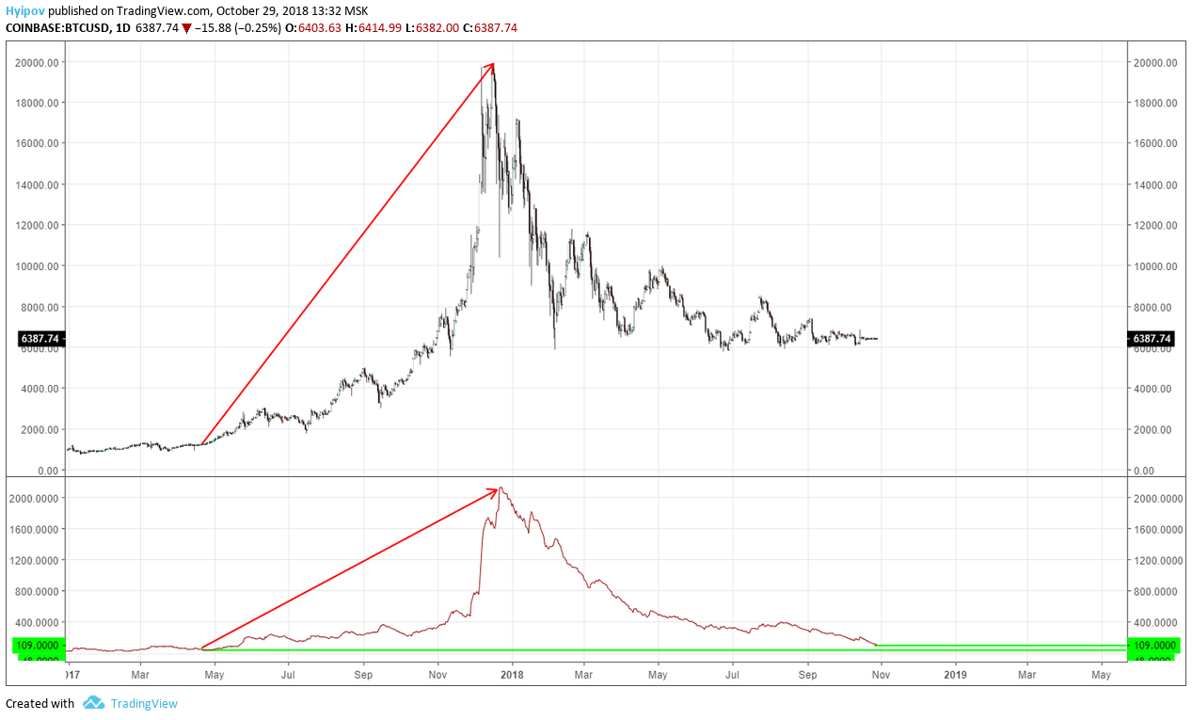
If you look at the BTC/USD price chart above, you’ll see that the volatility is very low, and ATR suggests that the average true range is as narrow as 109 USD. However, if you go back to May 2017, just ahead the crypto rally started, you’ll see that the indicator was at 48 USD at that time; so, the consolidation may go on.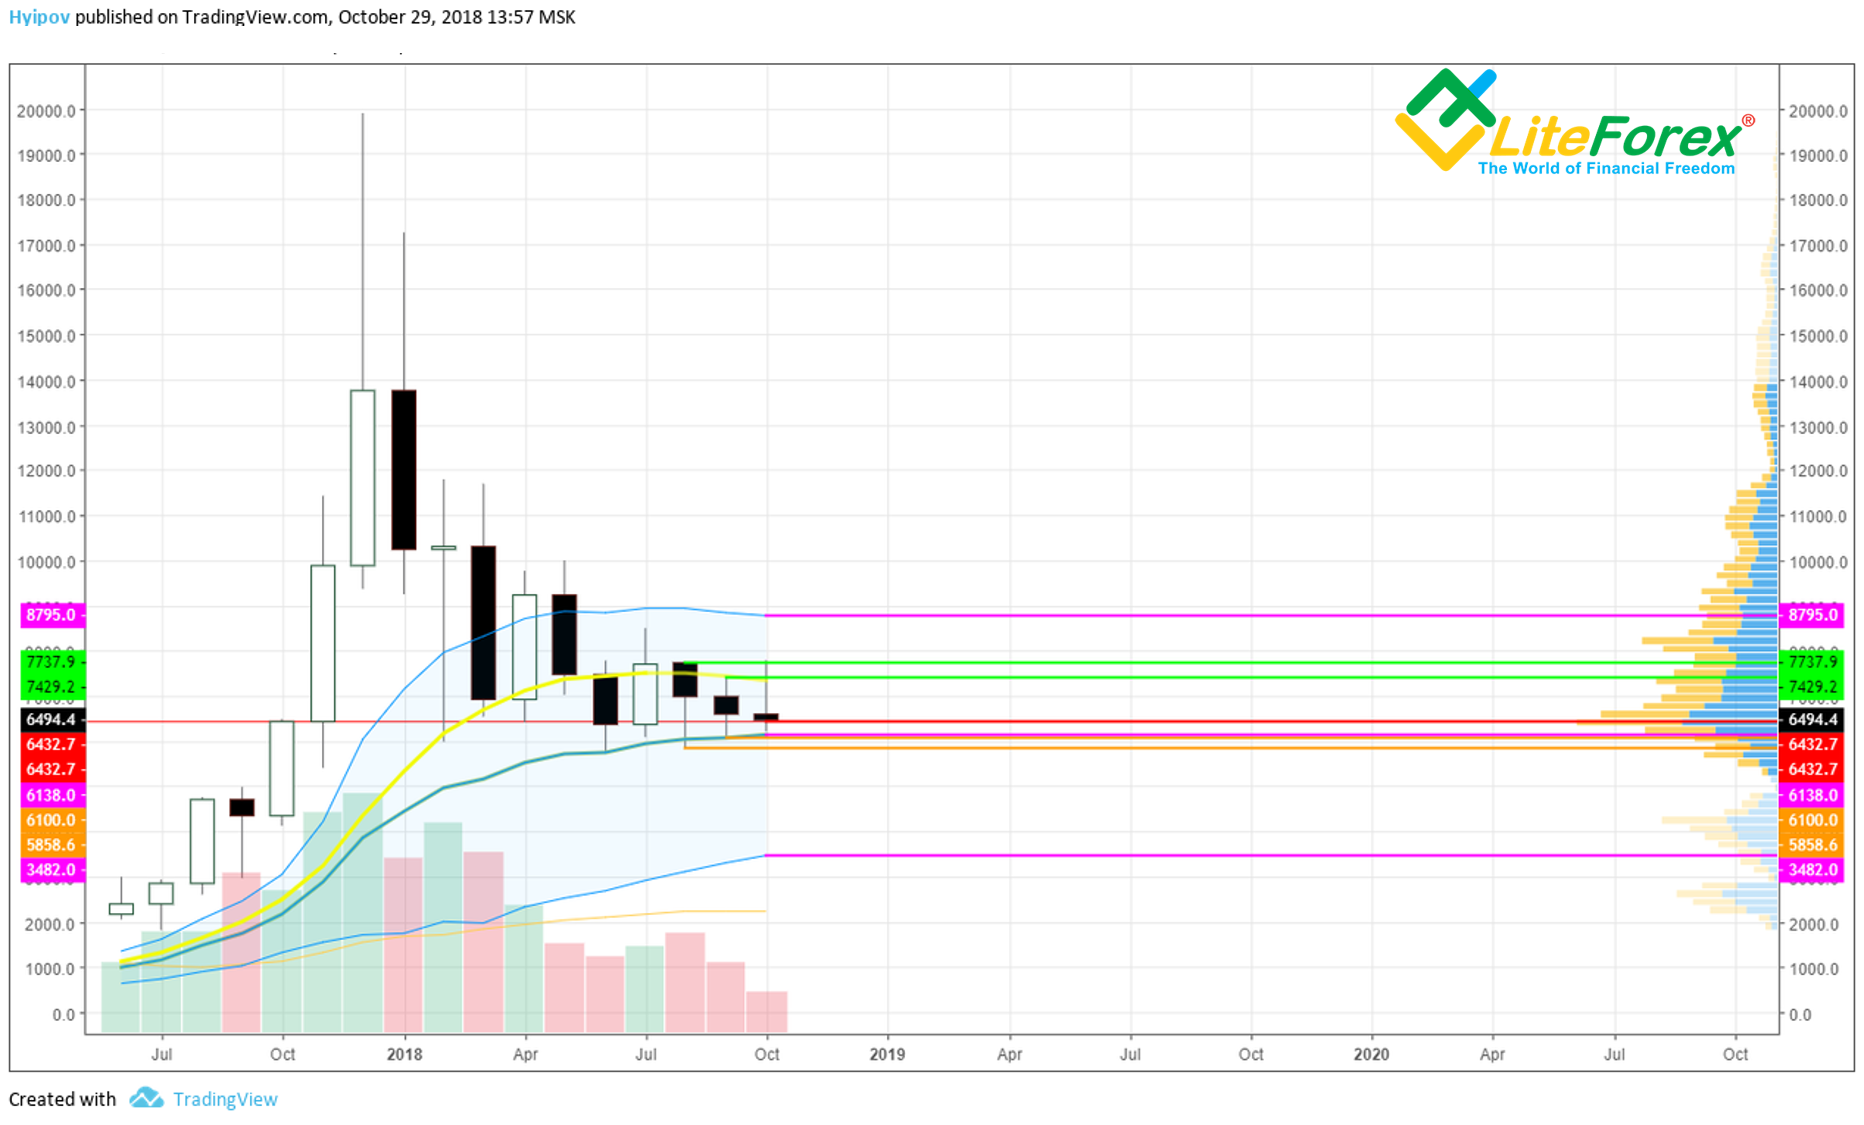
As you see in the BTC/USD monthly chart, the last October candlestick is about to close, swinging at the level of the global point of control in the volume profile, at 6432.7 USD. The body of the last candlestick is very narrow, and its open and close levels are lower than the previous ones. The low is close to Keltner channel’s central line. So, I can suggest strong support zone, between 5858.60 USD and 6432.70 USD.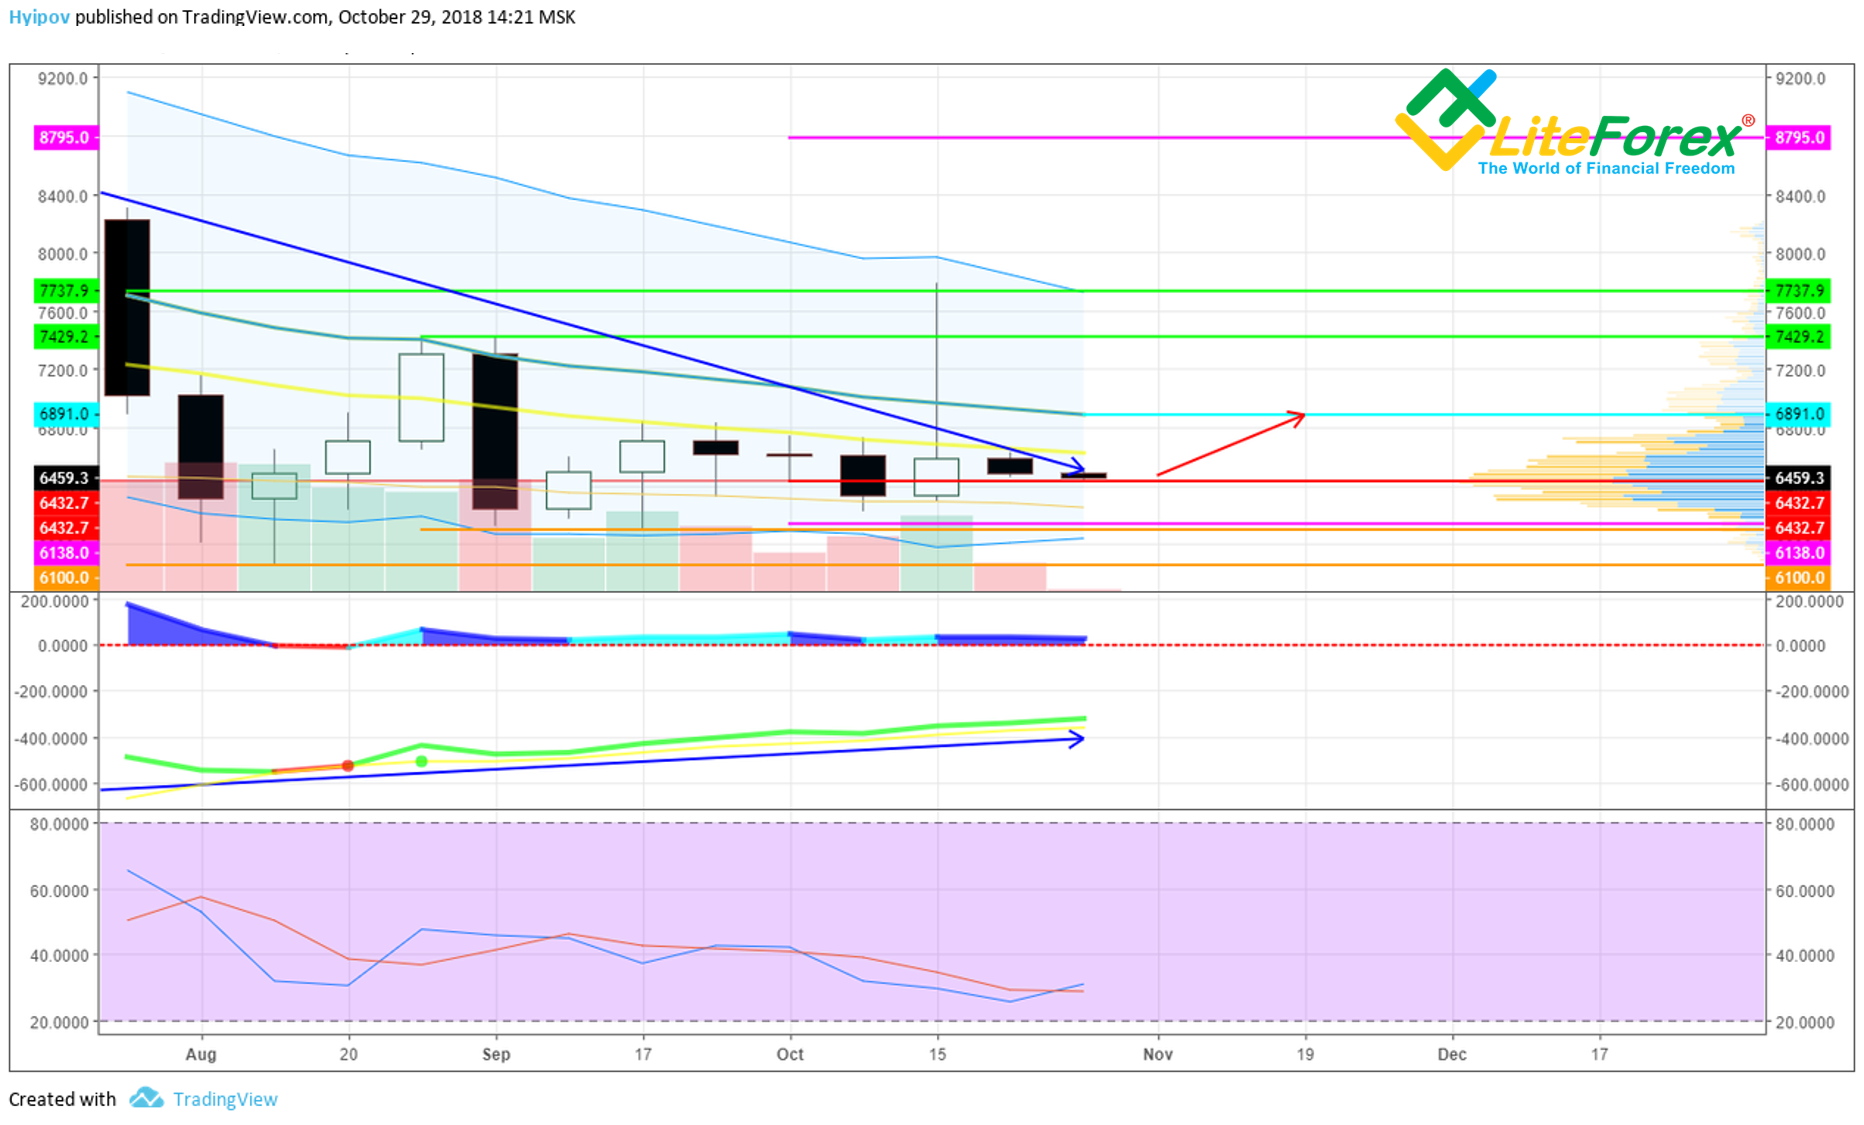
If look at the BTC/USD weekly chart, you’ll see that the pair is trading in the sideways trend inside the bearish trend. There are multiple support levels, which prevent the ticker from going lower than 6000 USD. There is a little more space above. The nearest resistance level is at about 6800 USD– 6891 USD.
Oscillators look weak, but they also suggest a little up-move. In addition, there is quite a long bullish divergence. MACD is steadily going up, despite the price going down. The MACD location below zero level proves that the market is bearish; however, its moving up suggests some hope for the trend reversal soon.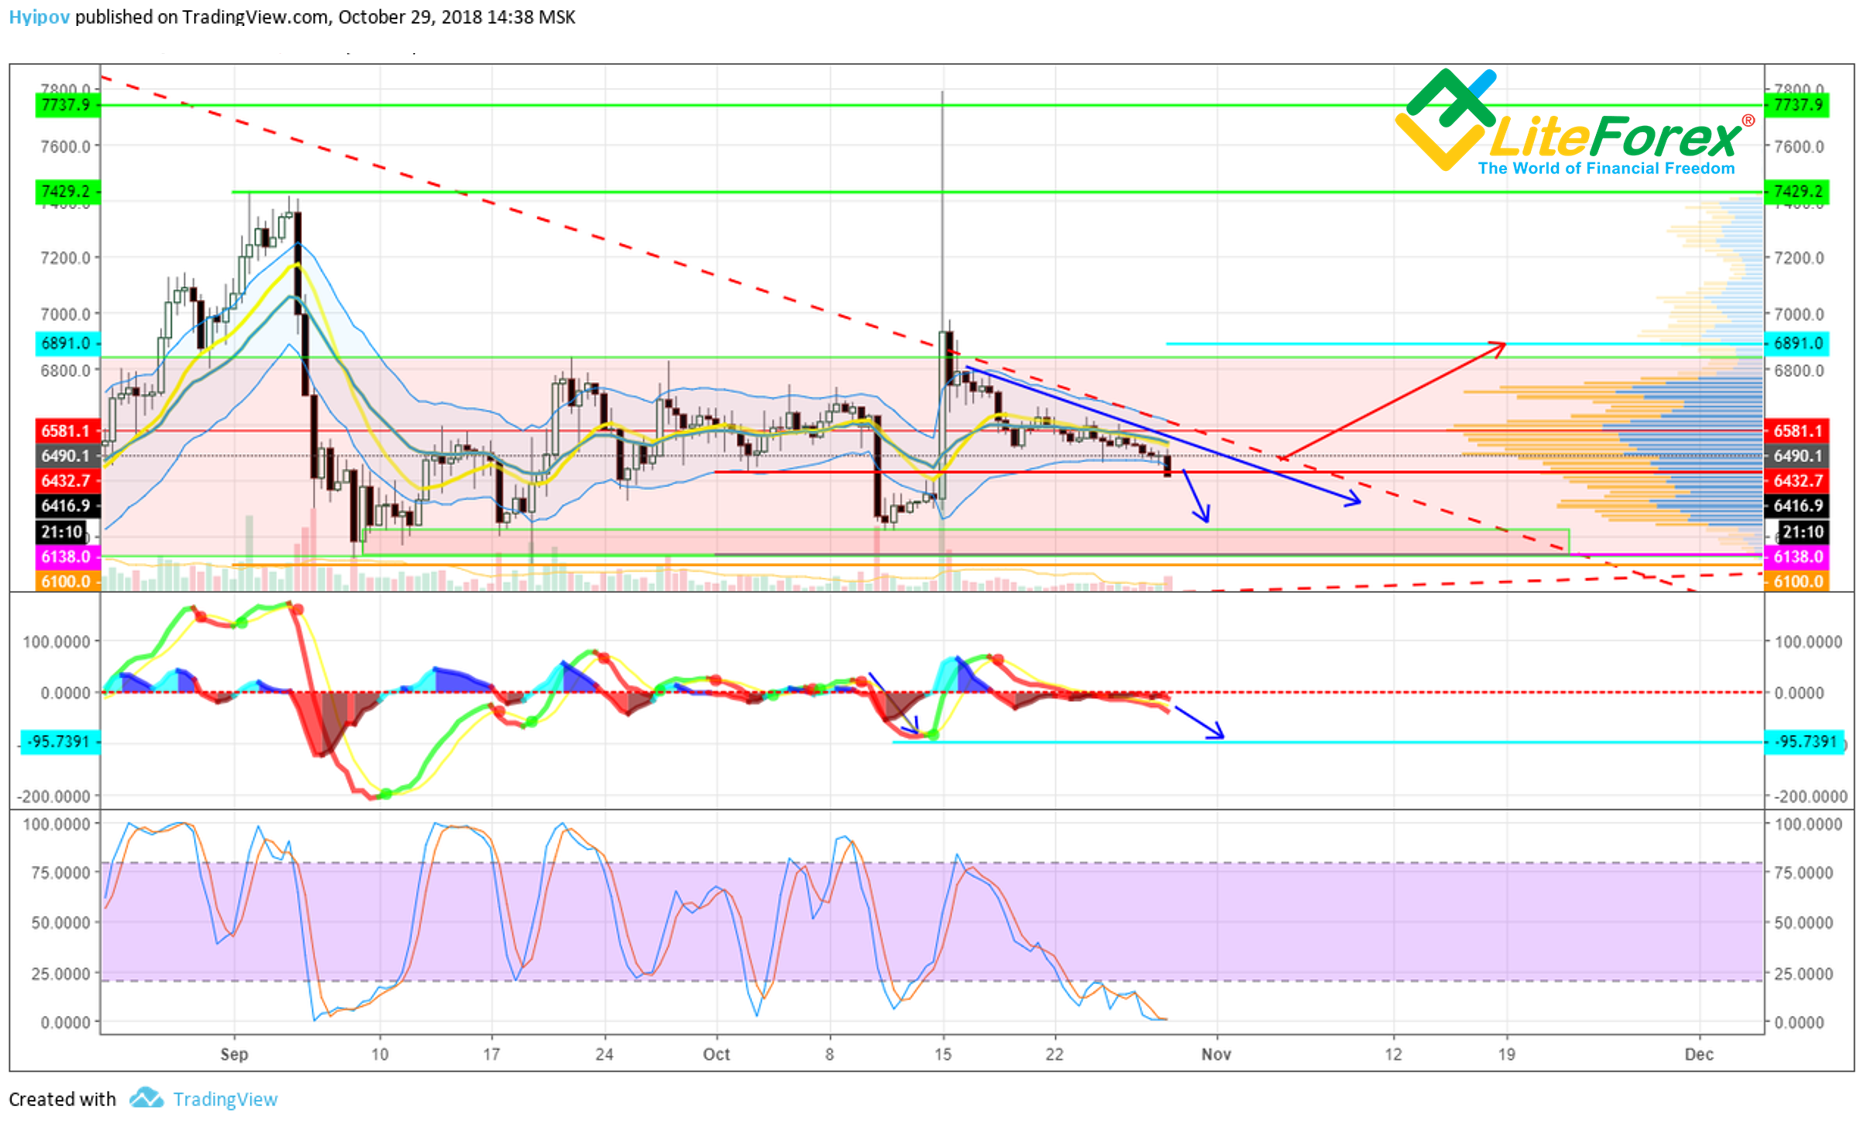
In the BTC/USD 12H chart above, it is clear that, despite the RSI stochastic, being at its low, MACD has just crossed zero level. Besides, the BTC/USD ticker is moving along the bearish trend, showing no sign of penetration it. All this means the buyers’ current weakness and a possible drawdown to the trading channel’s bottom border at 6200 USD.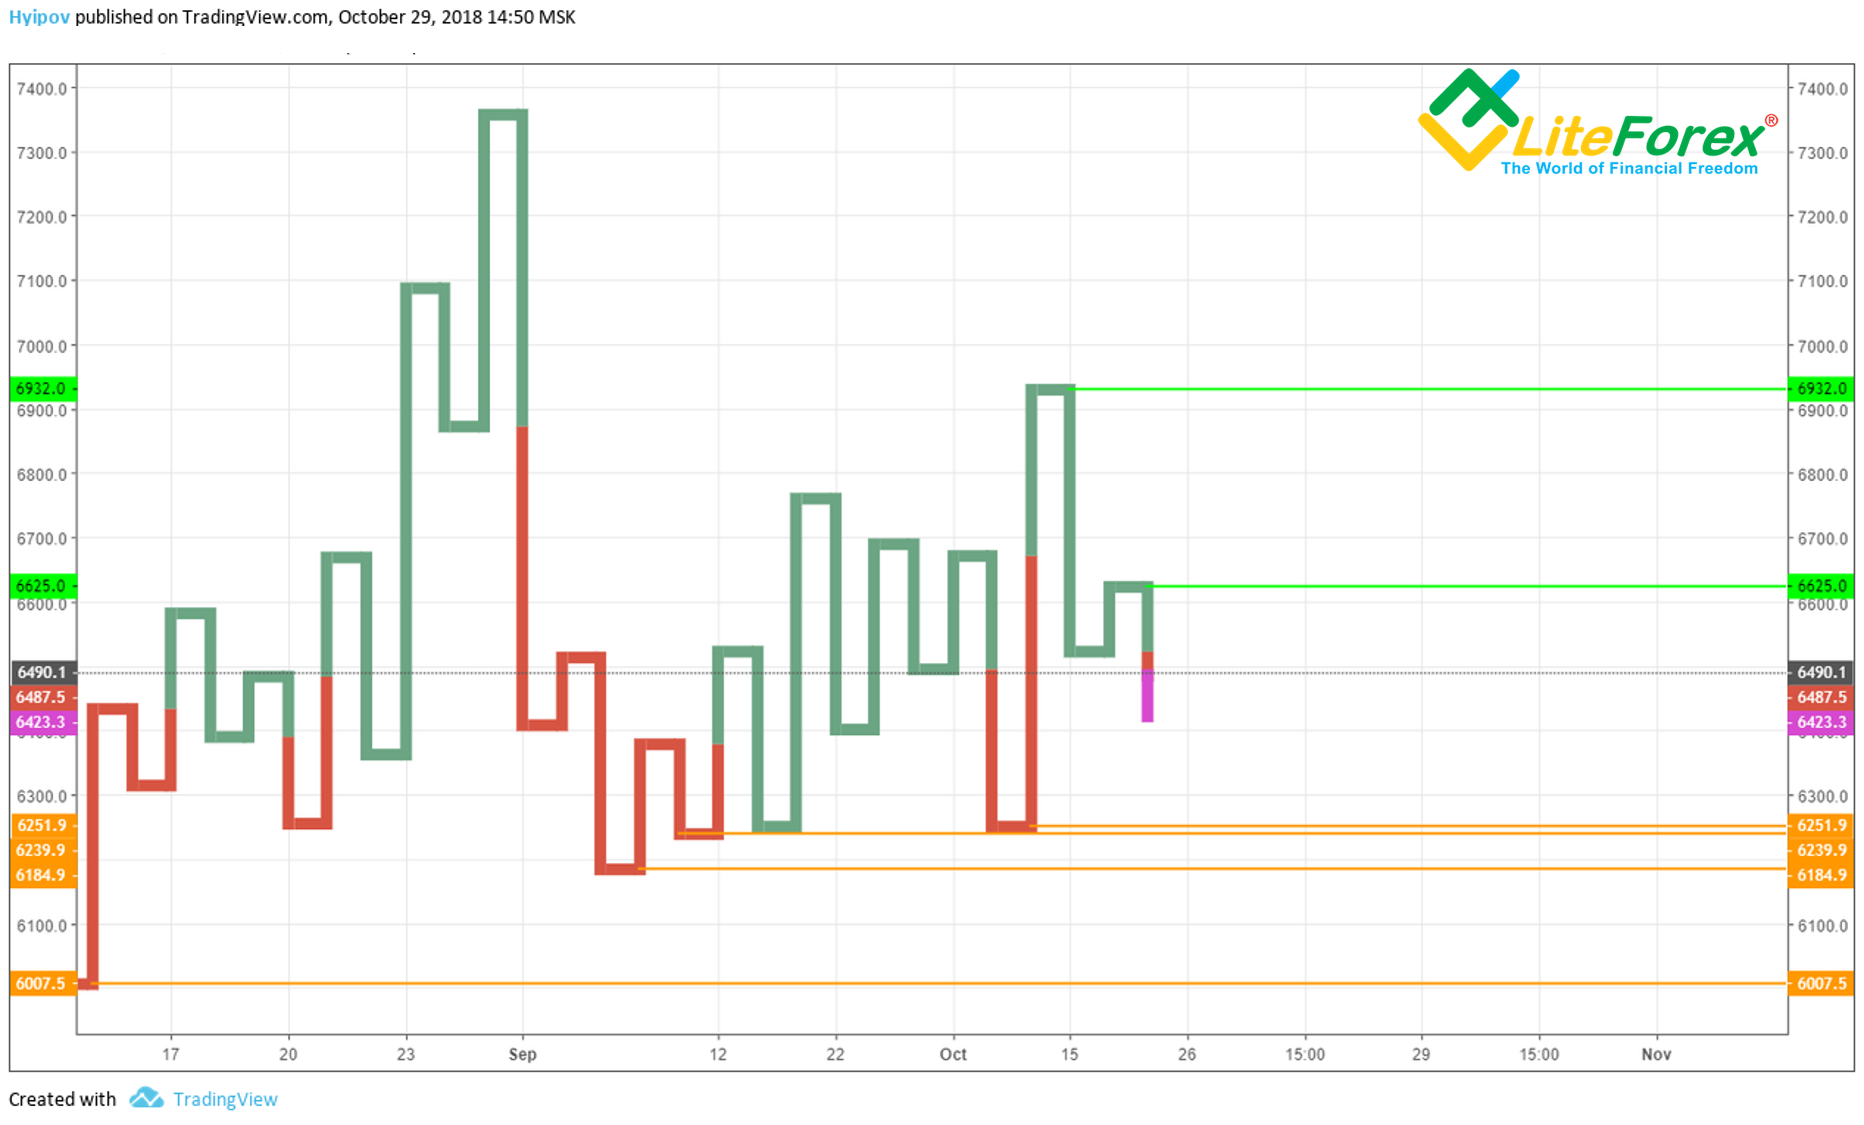
In the Kagi 12H chart, there are also multiple unclosed waist levels at about 6200; it proves the strong local support zone there.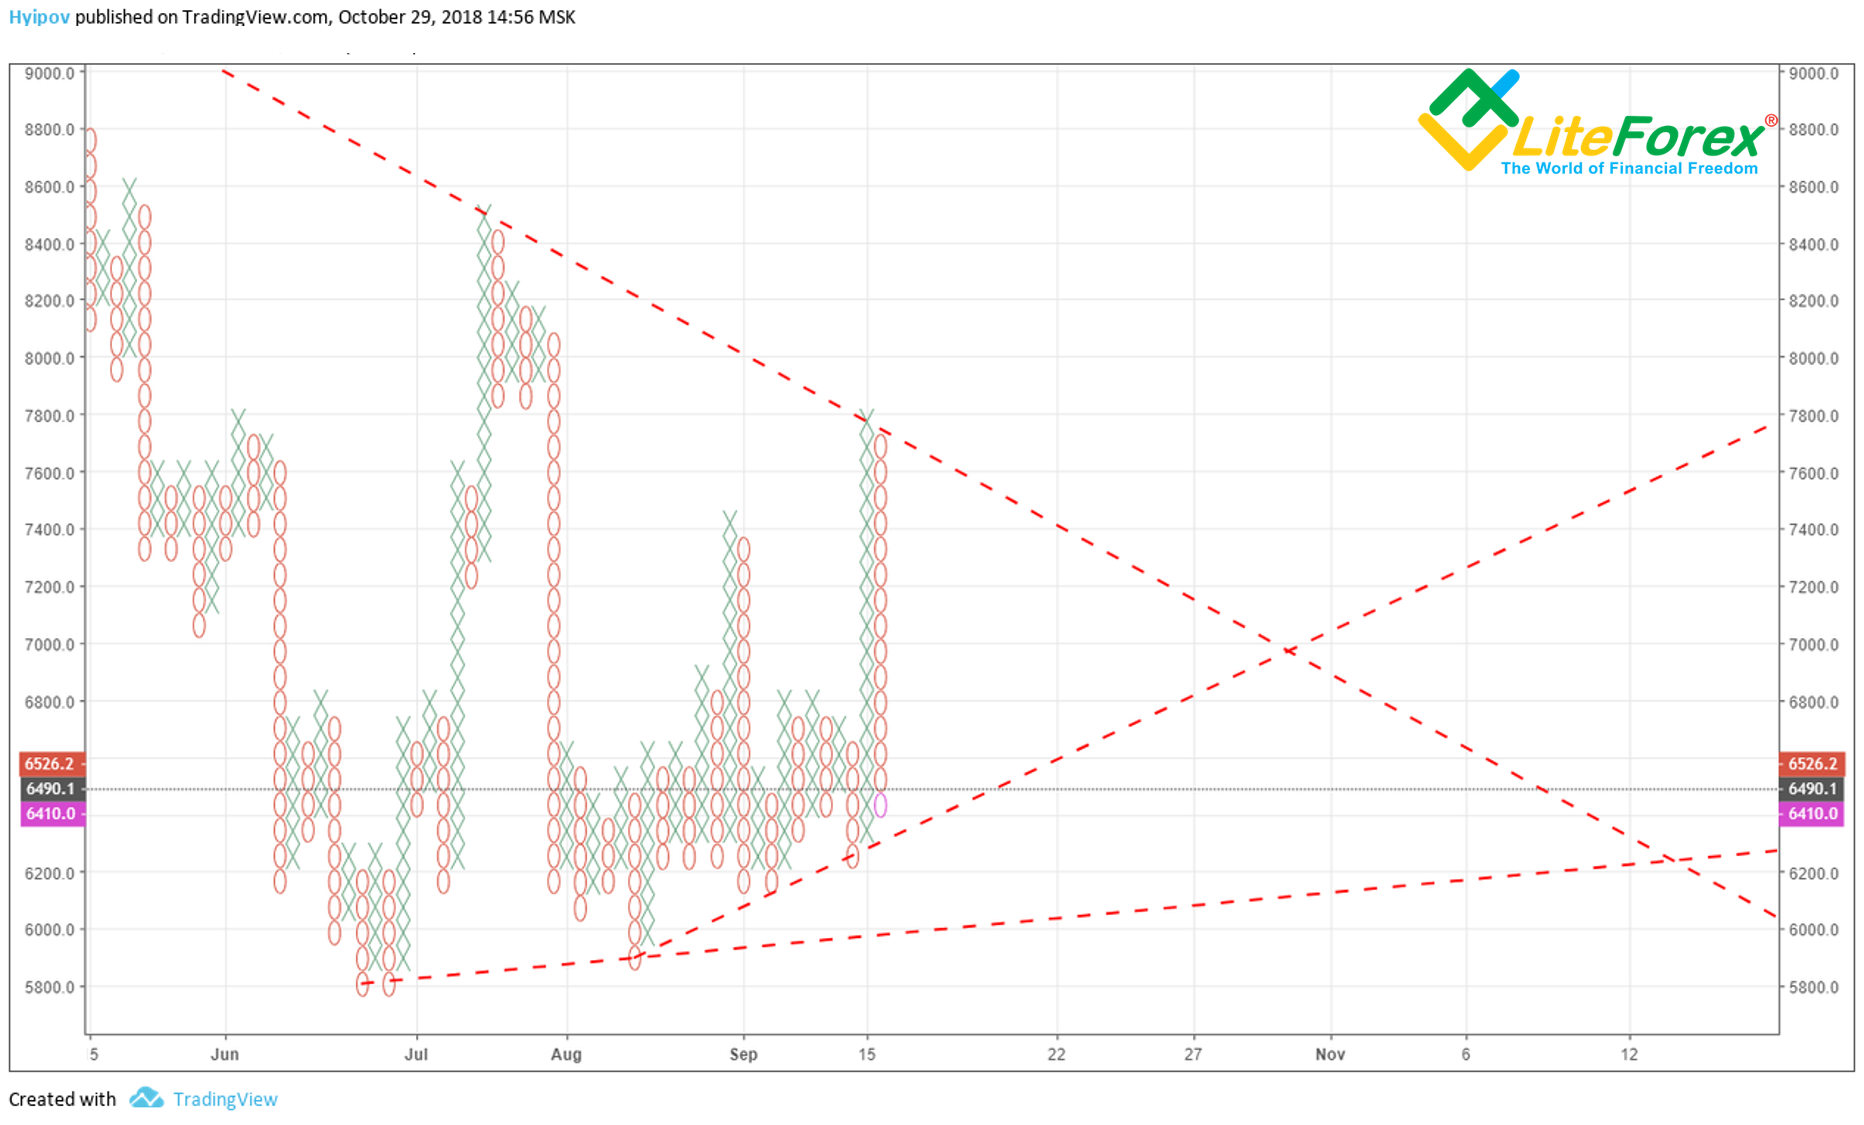
According to the Tic-Tac-Toe 12H chart, the room for movement is even less, limited by the level of 6300 USD; however, it must be taken into account that the chart displays only close level, so the spike itself can down lower.
Updated BTC price forecast and BTC/USD trading scenario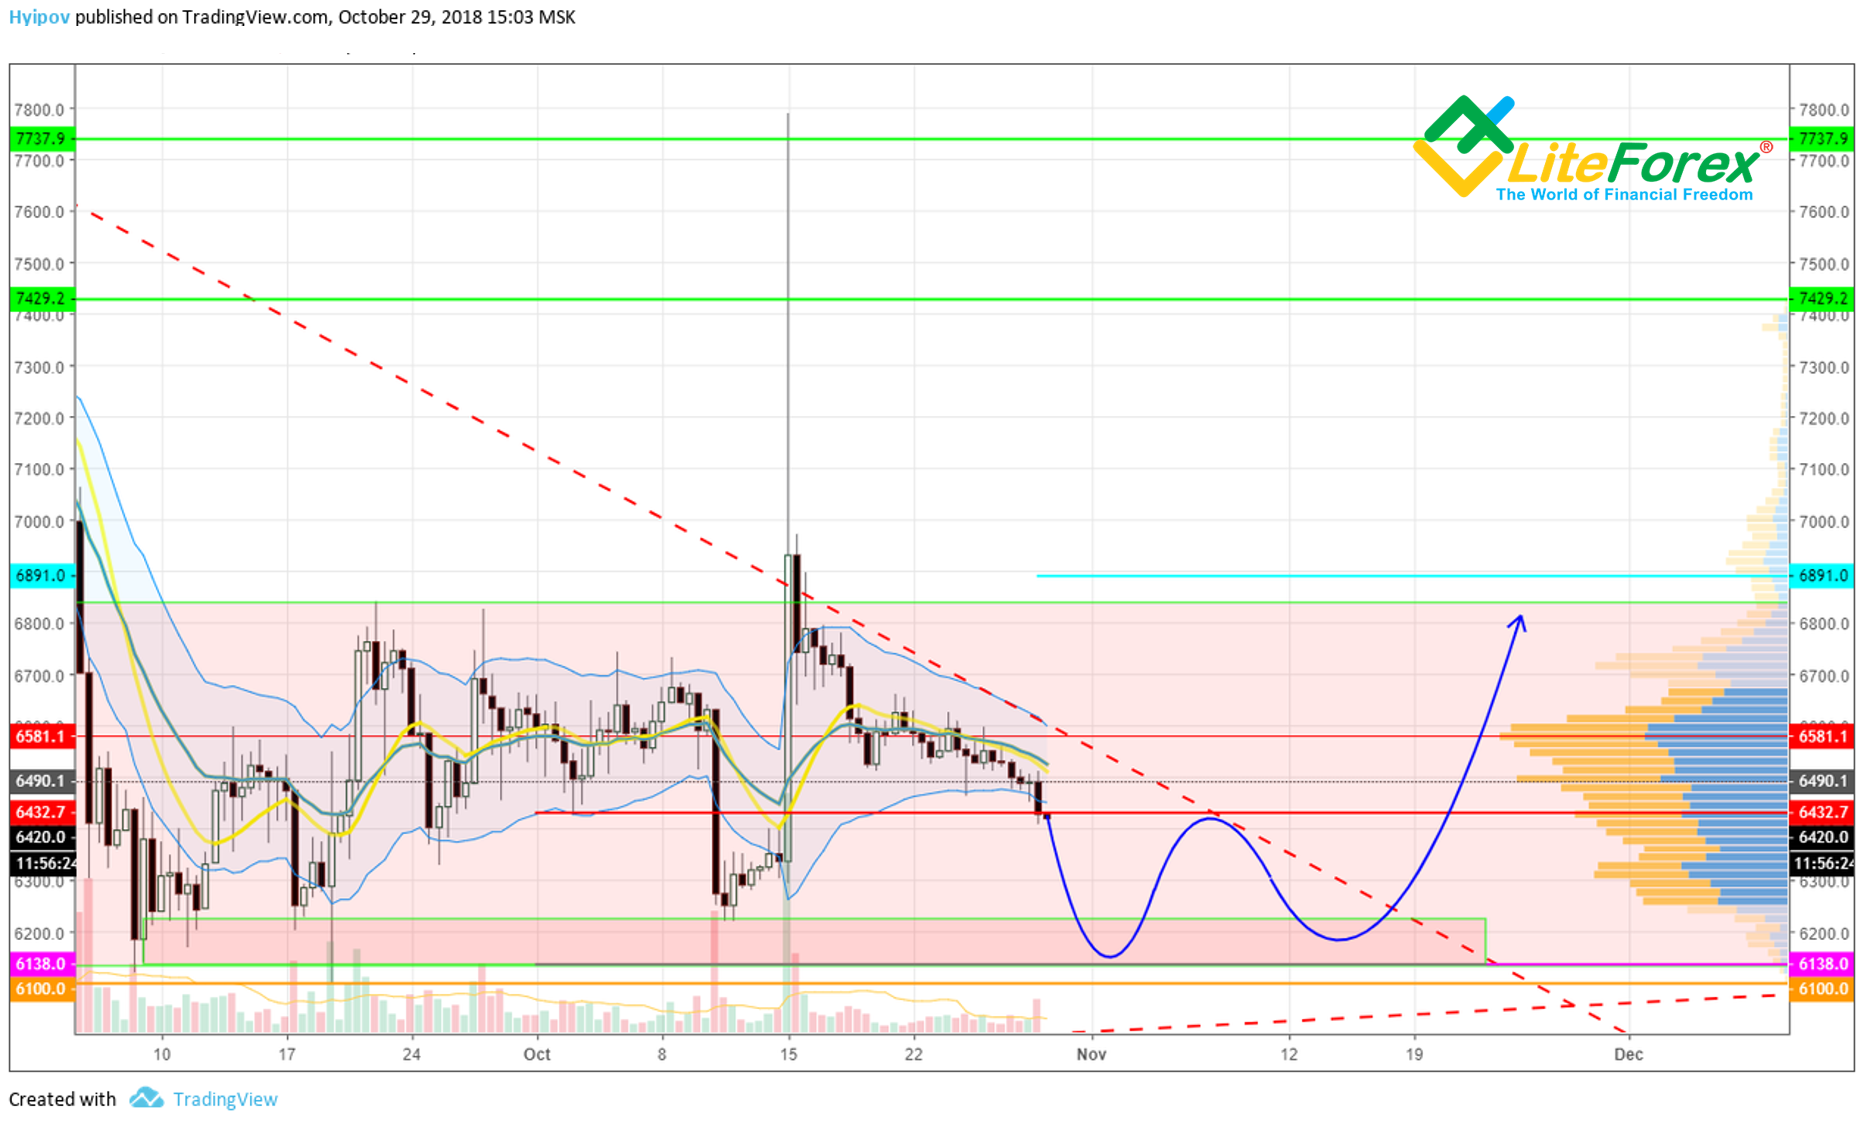
Summing up all the above, I can say that despite the attempts to break through the triangle’s upper leg, the trend has a very strong influence on the instrument. It is the further evidence that the breakout, occurred on 15.10.2018, was false. In general, it is clear that the market is still ignoring positive news, which suggests strong sellers. In this environment, it is makes some sense for manipulators to try to drop the Bitcoin price as low as possible, ahead the really important events, when really big participants will enter the crypto market. The hope for these events, followed by the expected Bitcoin rate surge, prevents BTC from crashing down.
But when a certain event, determining the market sentiment, is really expected, manipulators are likely to spread fake news, suggesting negative. I’m sure it will happen in the near future, driving the BTC down to the trading channel’s bottom border at about 6100 – 6250 USD.
Therefore, the previous scenario hasn’t been basically changed. The most likely scenario for BTC/USD pair still suggests it should go down and then return to the triangle’s upper leg and break it through. The trajectory will be shifted a little, as the upper leg is moving down.