
BTC Technical Analysis
As of right now, Bitcoin is continuing its roller-coaster ride. Since its all-time-high at $19716 on December 17, 2017, Bitcoin dropped by more than 82 percent, all the way down to $3429. This was by no means unexpected, as the Moving Average Convergence Divergence (MACD) and The Relative Strength Index (RSI) showed bearish divergences and oversold regions. After an incredible rise from just $0.5 to $32, Bitcoin fell by almost 94 percent back to roughly $2 in 2011, which was still a net increase of 400 percent. In 2013 Bitcoin declined by more than 81 percent and just a year later it fell by 93 percent as a result of the famous MtGox hack.
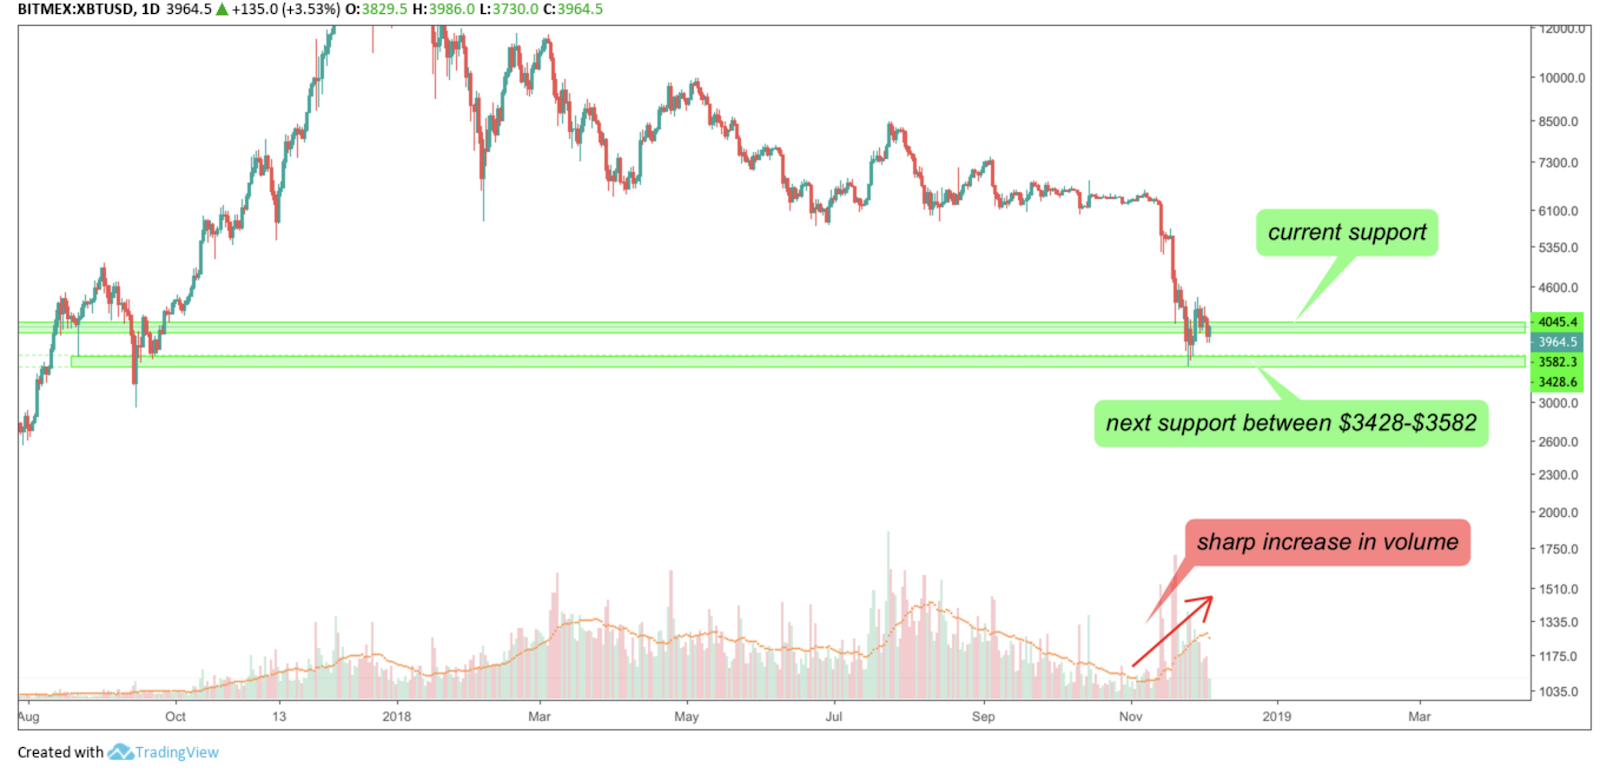
XBT/USD DAILY CHART
Bitcoin is currently going back and forth between two major support zones and if the current support at $3900 to $4050 fails to hold, it will find its next support at the $3428 to $3582 range.
XBT/USD DAILY CHART
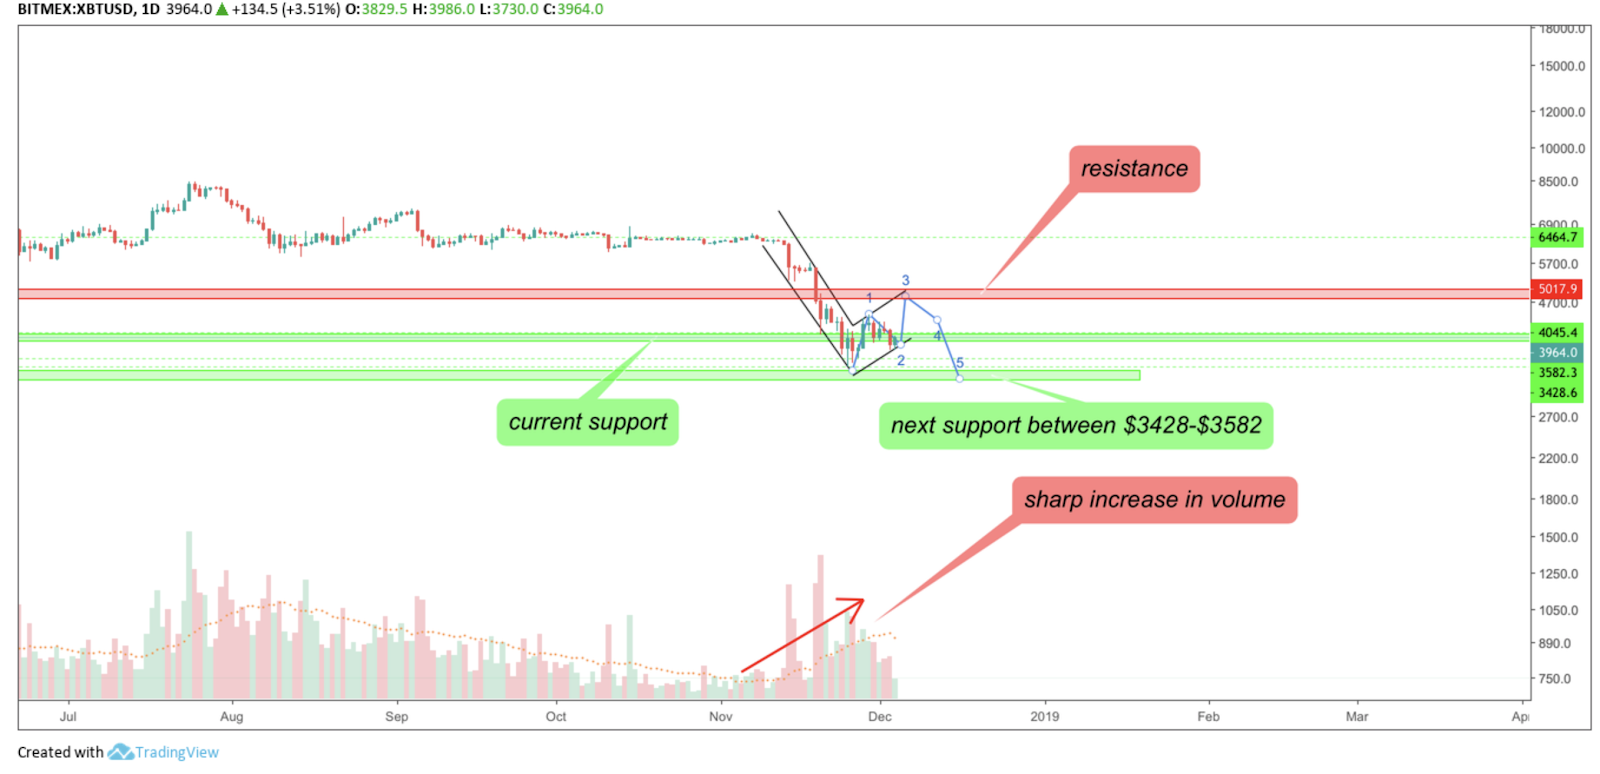
However, the sharp increase in volume during the most recent price drop is a very bearish sign. Additionally, Bitcoin is potentially going to form a bear flag if it stays at the current support and forms a higher low. The high of that wave would be located between $4792 and $5017, which is exactly where Bitcoin will face a very strong resistance.
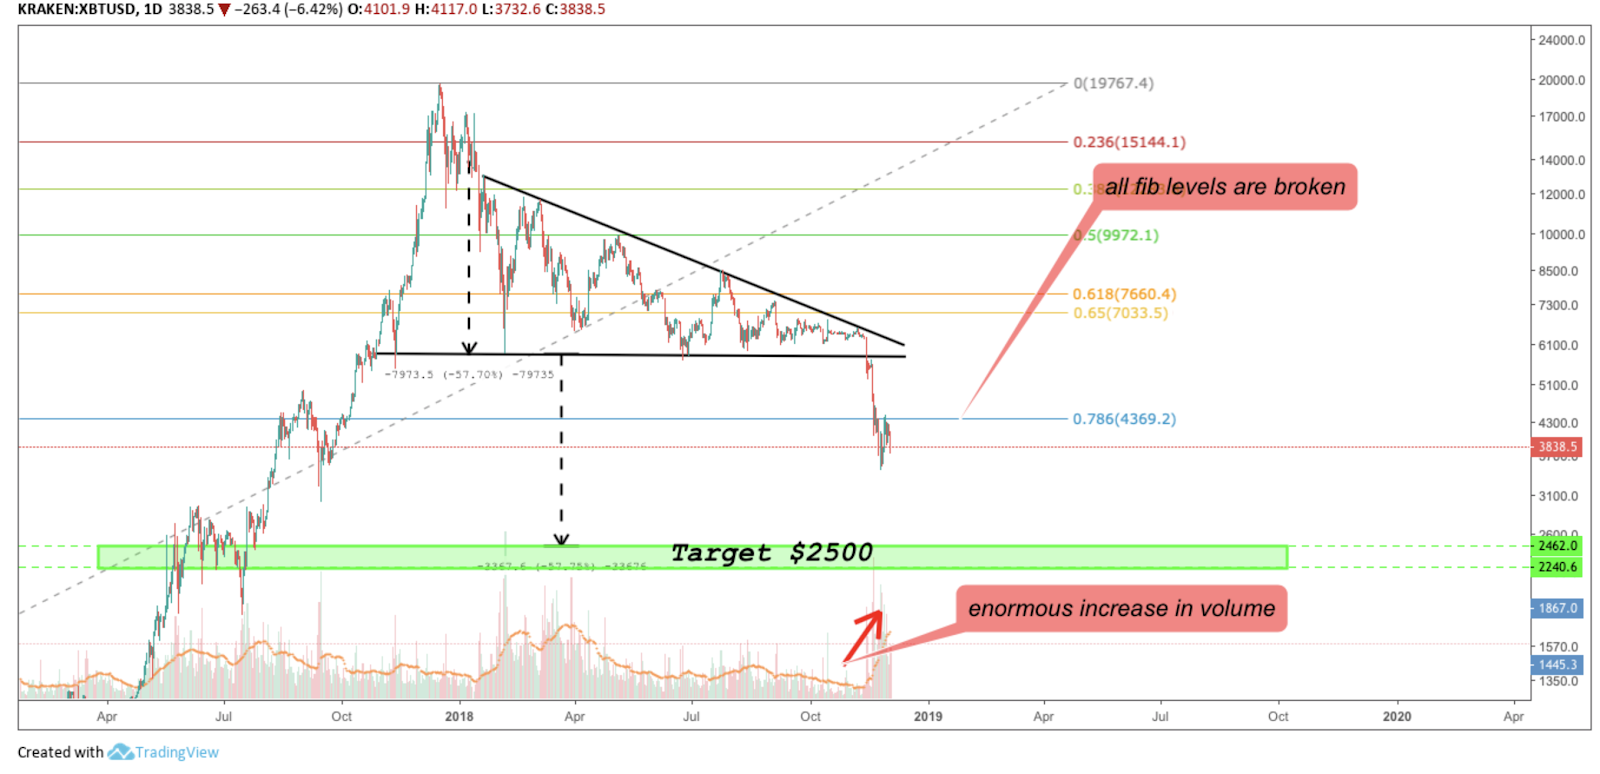
XBT/USD DAILY CHART
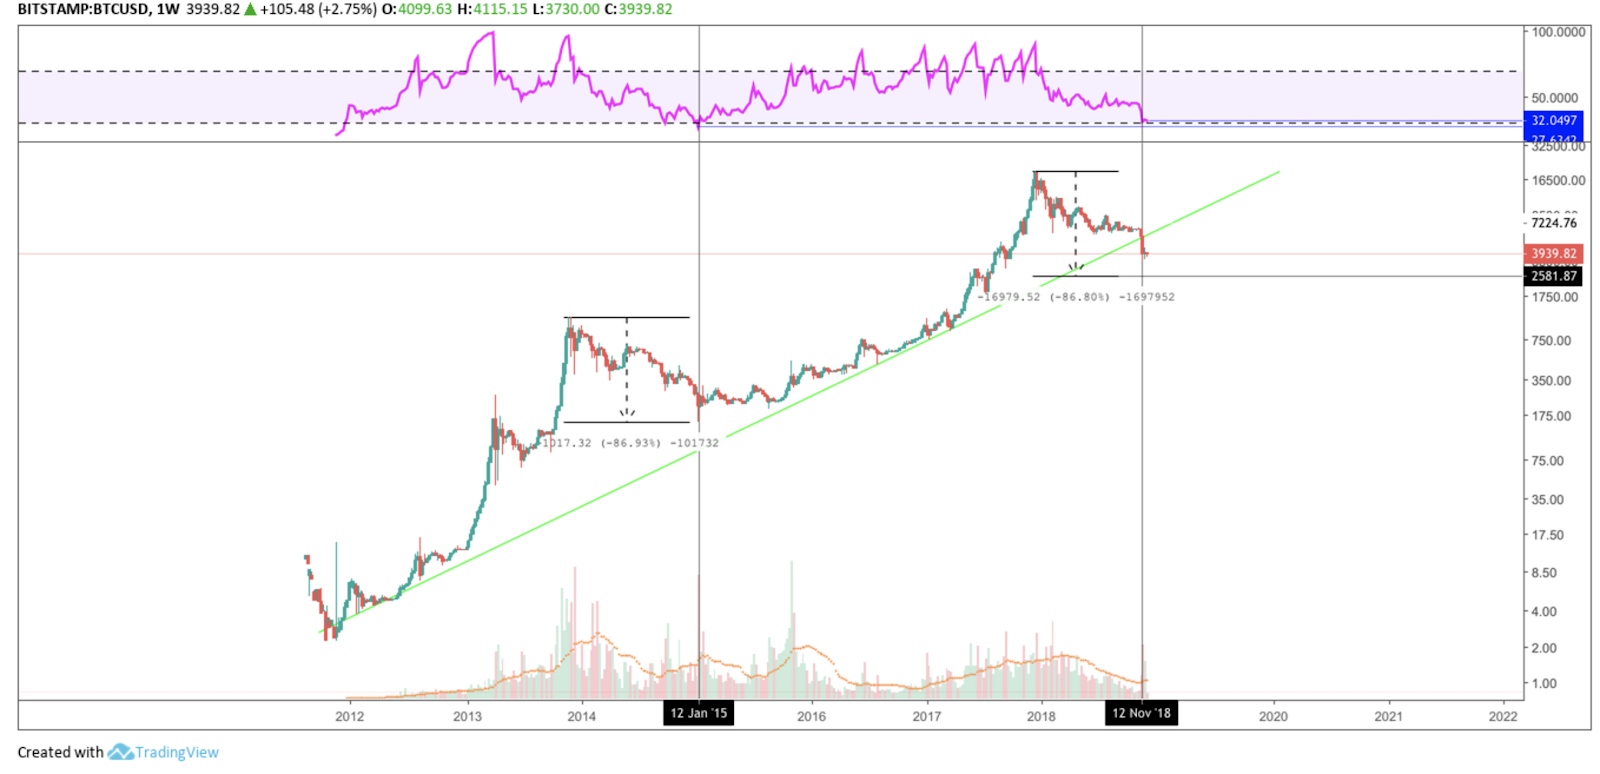
Furthermore, Bitcoin broke out of the bearish descending triangle pattern with the largest trading volume in the last six months, losing almost 50 percent from its last high to its most recent low. Moreover, since the Fibonacci retracement was established on January 13, 2015, every fib level has failed to hold. This makes it highly likely Bitcoin will go down all the way to the target of the descending triangle, which is located at approximately $2500.
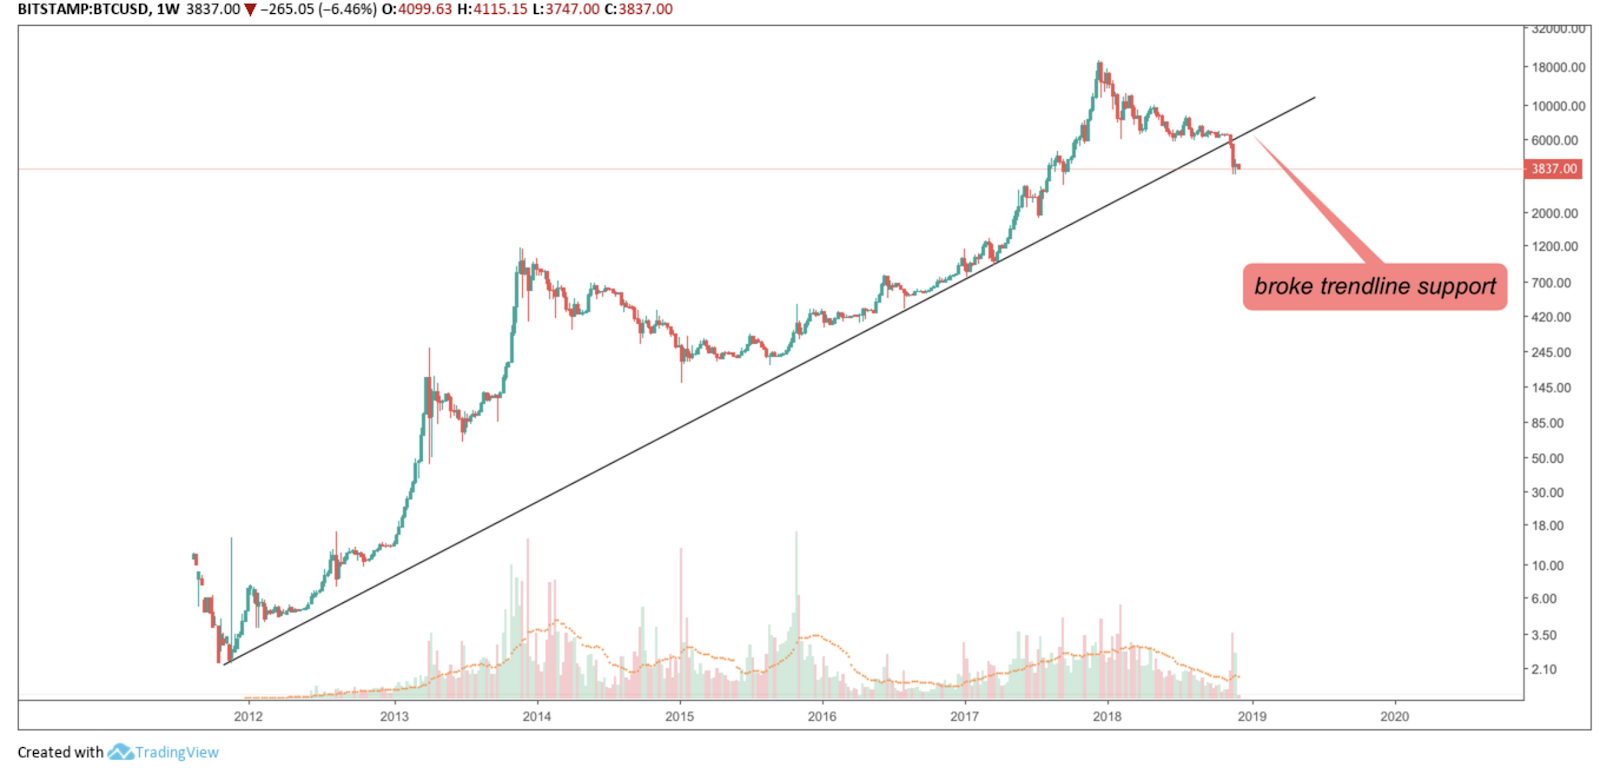
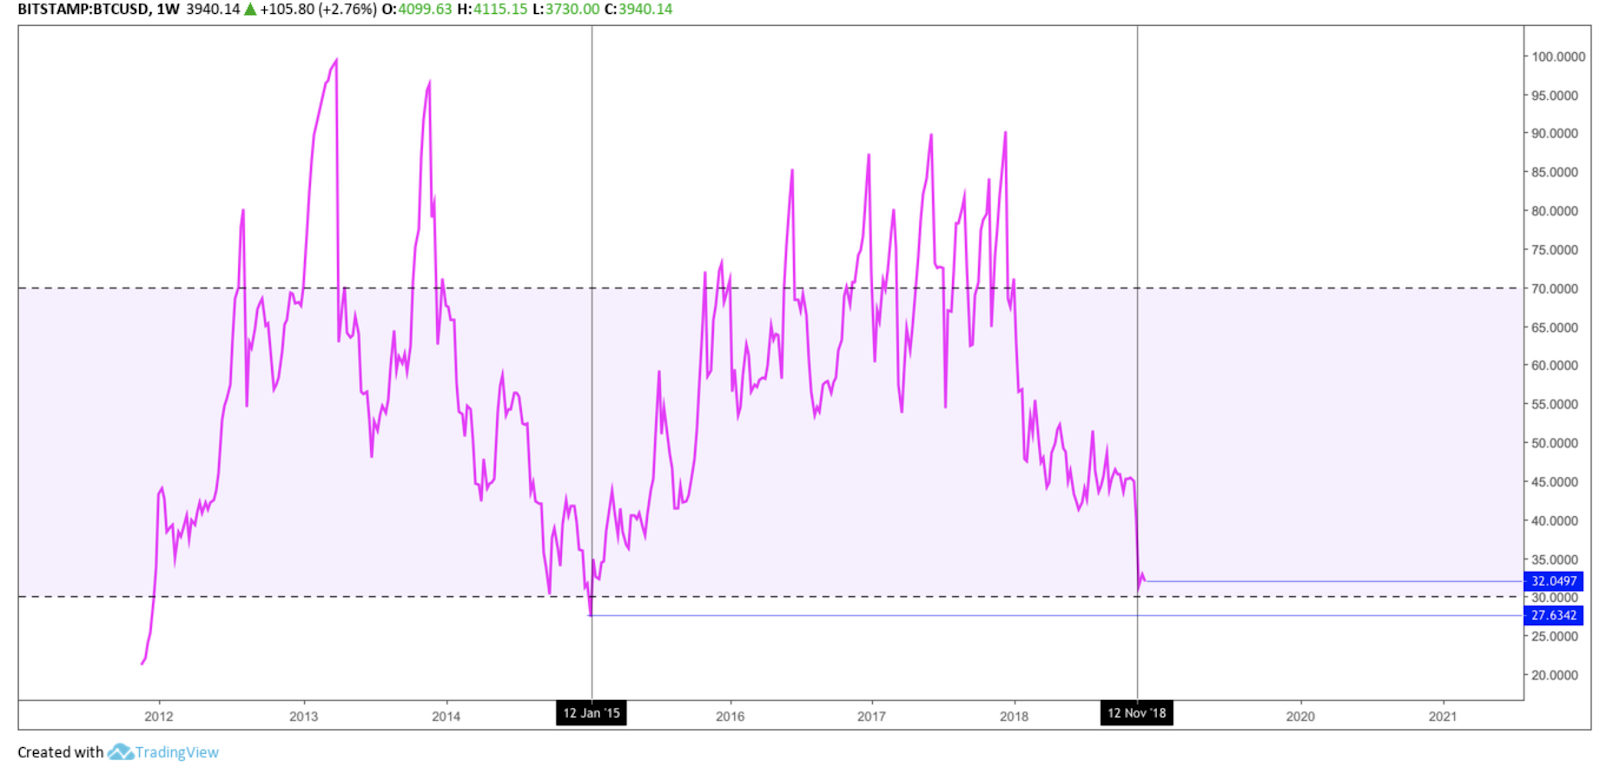
BTC/USD WEEKLY CHART
But not only that, Bitcoin even broke the trendline which started in 2012 and was officially established on the first of August, 2016, more than two years ago at the time of writing.
While all of the above is indicating a very bearish development for Bitcoin’s price in the upcoming months, we should also take a look at the indicators.
BTC/USD WEEKLY CHART
The RSI almost reached it’s all-time-low (ATL) of 27.63 in the weekly chart, going as low as 32.
BTC/USD WEEKLY CHART
The all-time-low of the RSI was established when Bitcoin reached its low on January 12, 2015. Since then, Bitcoin was in a continuous upward movement, which is commonly referred to as a bull market. Interestingly enough, if Bitcoin loses 4.5 points on the RSI, it will have to re-test the ATL of the RSI. This would simultaneously result in an identical price decline as in the bear market that Bitcoin faced between 2013 and 2015. Having said that, an identical decline by almost 87 percent would result in a price bottom of $2581, which is the price range that the target of the descending triangle is located at.
BTC/USD WEEKLY CHART
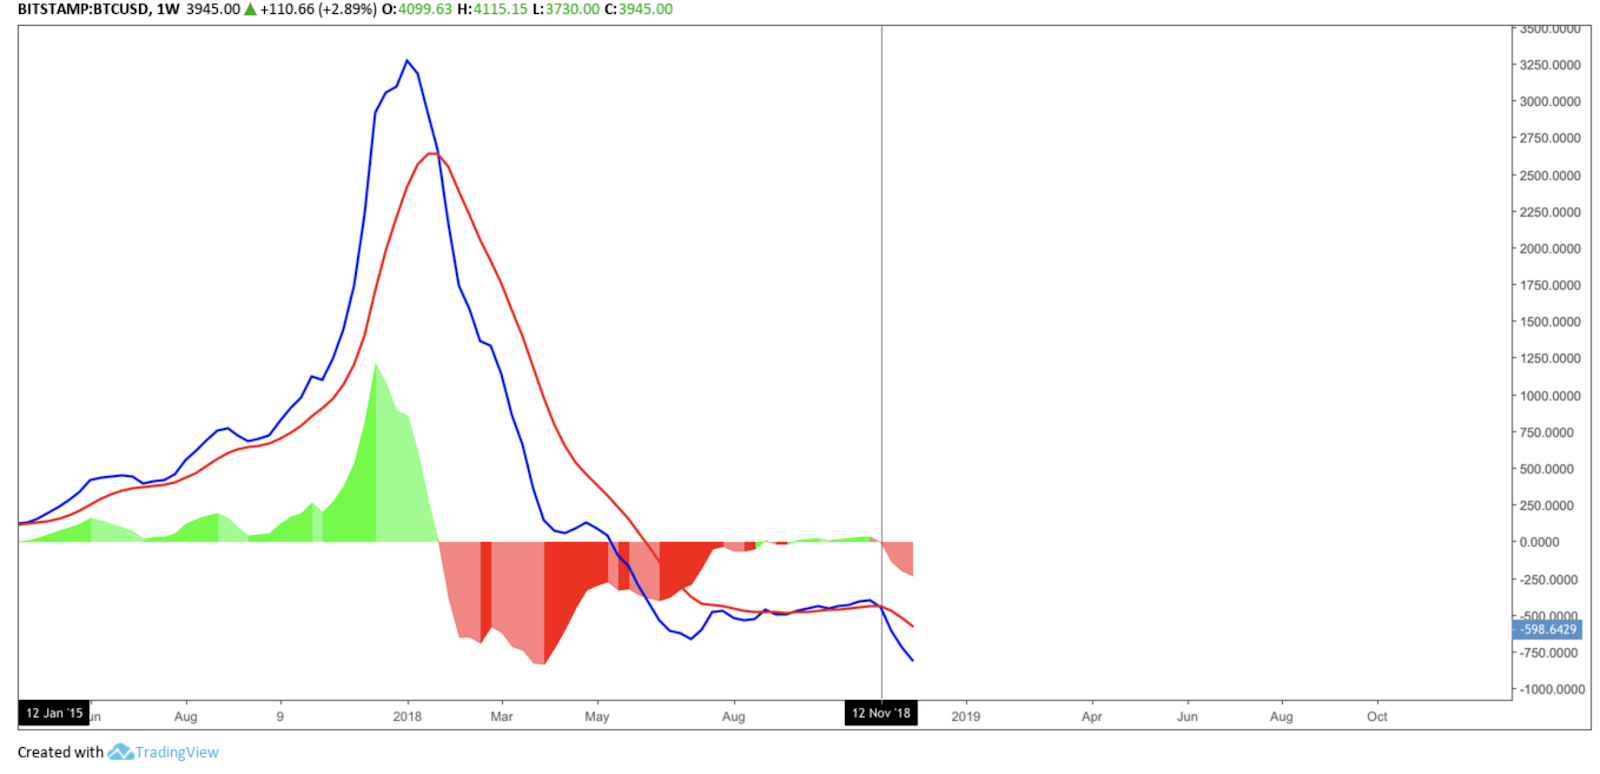
The Moving Average Convergence Divergence recently crossed bearishly, indicating further downward movement. However, with the MACD being as low as that, the decline in price should find its end in the not too distant future.
BTC/USD WEEKLY CHART
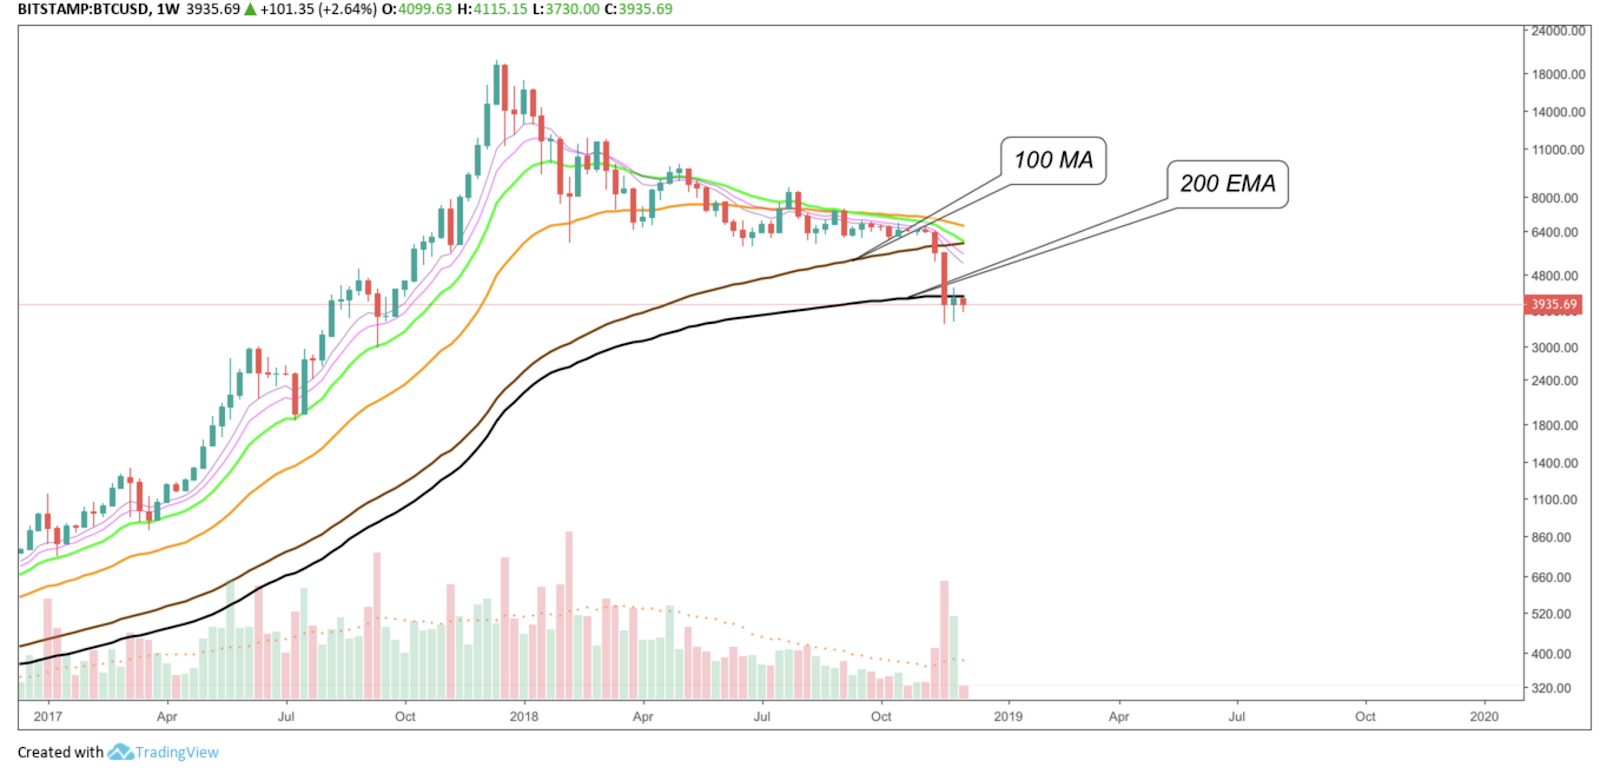
Both, the 100-week Moving Average (MA) as well as the 200-week Exponential Moving Average (EMA) were bearishly broken and failed to act as supports in the weekly chart.
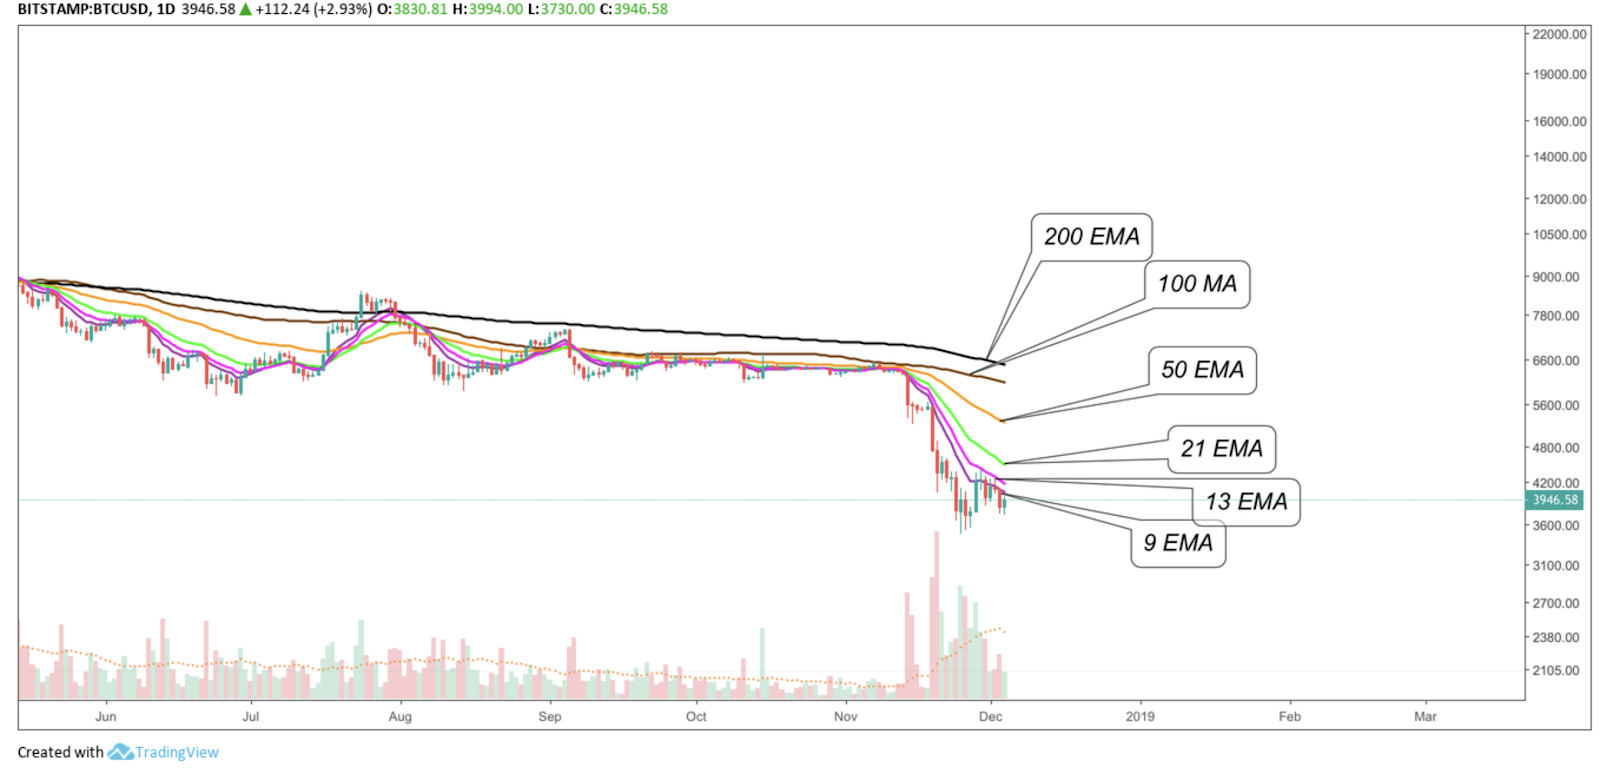
BTC/USD DAILY CHART
The same goes for the daily chart, where every EMA is bearishly located above the price chart, taking the Fibonacci numbers as EMA value.
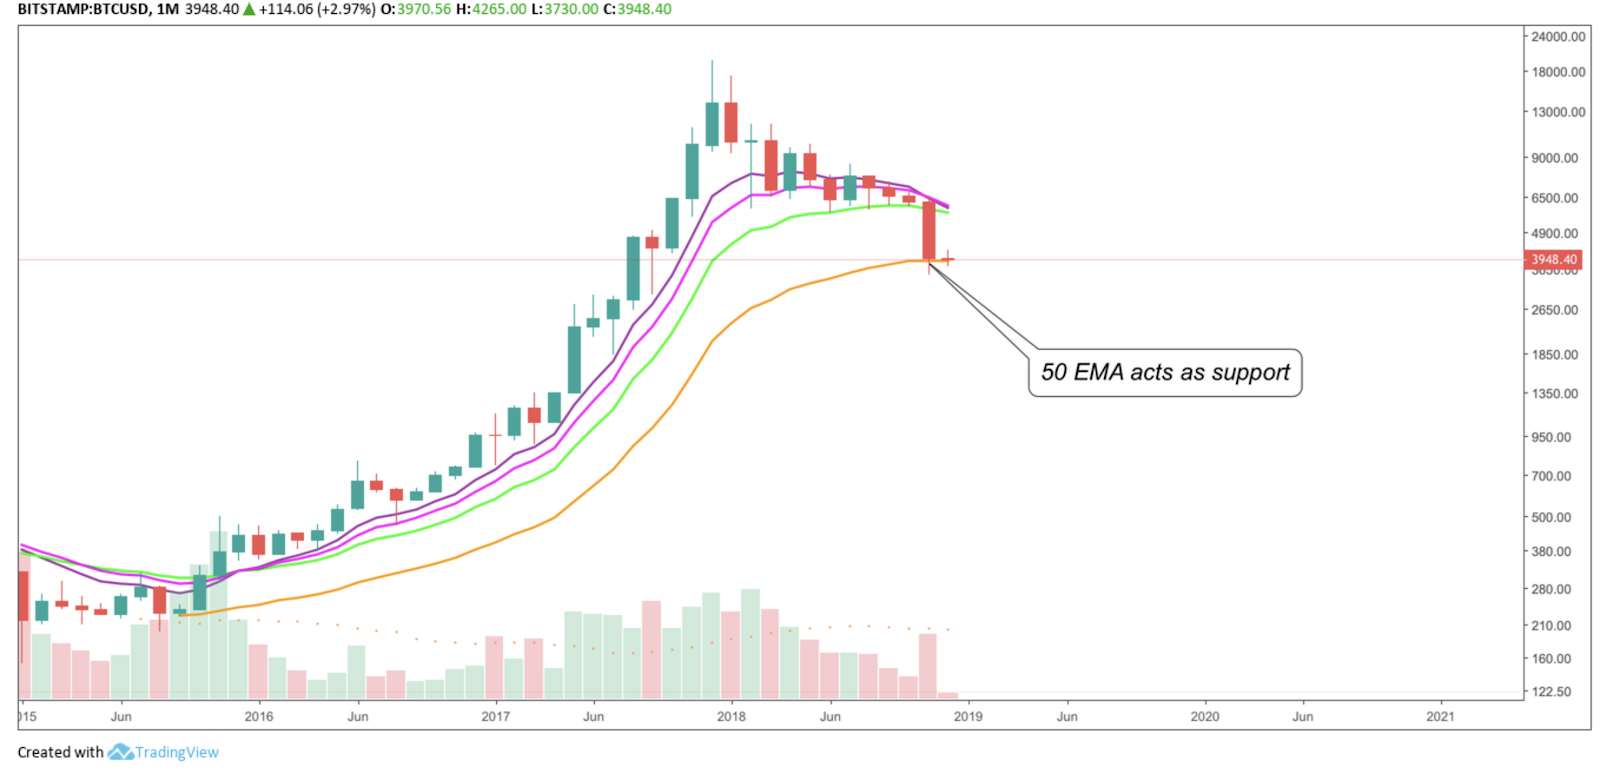
BTC/USD MONTHLY CHART
Having said that, the only EMA which has succeeded to hold as support is the 50-month EMA in the monthly chart. If this EMA also breaks, the upside potential is dwindling small for the near future.
To conclude, there are numerous arguments for a continuation of the bear trend for bitcoin and very little for an upward movement in the upcoming weeks. However, this is only from a technical point of view, as the fundamental analysis might come to different conclusions.
While diverse industry experts, like Justin Tabb, CEO and Founder of Amplify Exchange, stated: “based on 1,000 iterations of our Monte Carlo simulation, Bitcoin is likely to consolidate around the $4,000 price level until the beginning of 2019 and it’s likely that Bitcoin continues its long-term bull run, with higher prices heading into the summer of 2019.
For Bitcoin to retest the all-time-high, blockchain solutions need widespread adoption and institutional money needs to enter the market. In short, there needs to be a catalyst. Bitcoin ETF’s and physically settled futures contracts will be huge catalysts for the market since they inherently reduce the supply in circulation. Less supply and more demand yields higher prices. It’s only a matter of time.”
It might turn around quicker than originally assumed, with a pending decision on the SolidX and Vaneck ETF and an upcoming future and digital asset trading platform in late January 2019. With that being said, Bitcoin might surprise technical analysts and begin its upward movement earlier than expected.