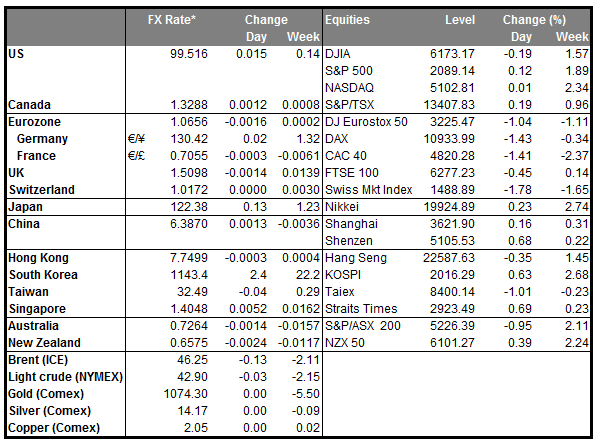
• British pound tumbles as BoE rate hike expectations are pushed back In the absence of any major data releases, the British pound weakened against the dollar yesterday. The movement was attributed on investors pushing back their expectations for the BoE to raise interest rates to the second half of 2016, as well as concerns over the referendum for a possible “Brexit” from the EU. Soft UK growth and wage data released recently support the argument that interest rates will be kept low for longer than the market initially expected. Also, the uncertain prospect of the UK leaving the EU increases capital outflow concerns, which in turn weakened the pound as the market prices in that risk. Overall, as further news on both of these topics come out, we could see the pound come under renewed selling pressure.
• Today’s highlights: Eurozone’s M3 money supply growth is expected to have accelerated to +5.4% yoy in November, from +5.3% yoy in October. This would drive the 3-month moving average up as well. This is usually not a major market mover, and therefore we are likely to see a minimal reaction from EUR.
• From Norway, retail sales data for November are coming out, but no forecast is currently available.
• From the US, pending home sales for November are forecast to have accelerated to +0.5% mom, from +0.2% mom in October. New home sales for the same month increased but existing home sales fell sharply, partly due to delays in closing deals caused by new federal regulation and rising home prices. Therefore, we expect the outcome of pending home sales to better gauge the future performance of home sales and whether there are any signs of concerns in the housing sector. Overall, we expect the housing market to continue finding support from increasing wages and improving employment and thus another supportive piece of housing data could prove positive for the dollar.
• We have no speakers scheduled on Wednesday’s agenda.
The Market
EUR/USD pulls back
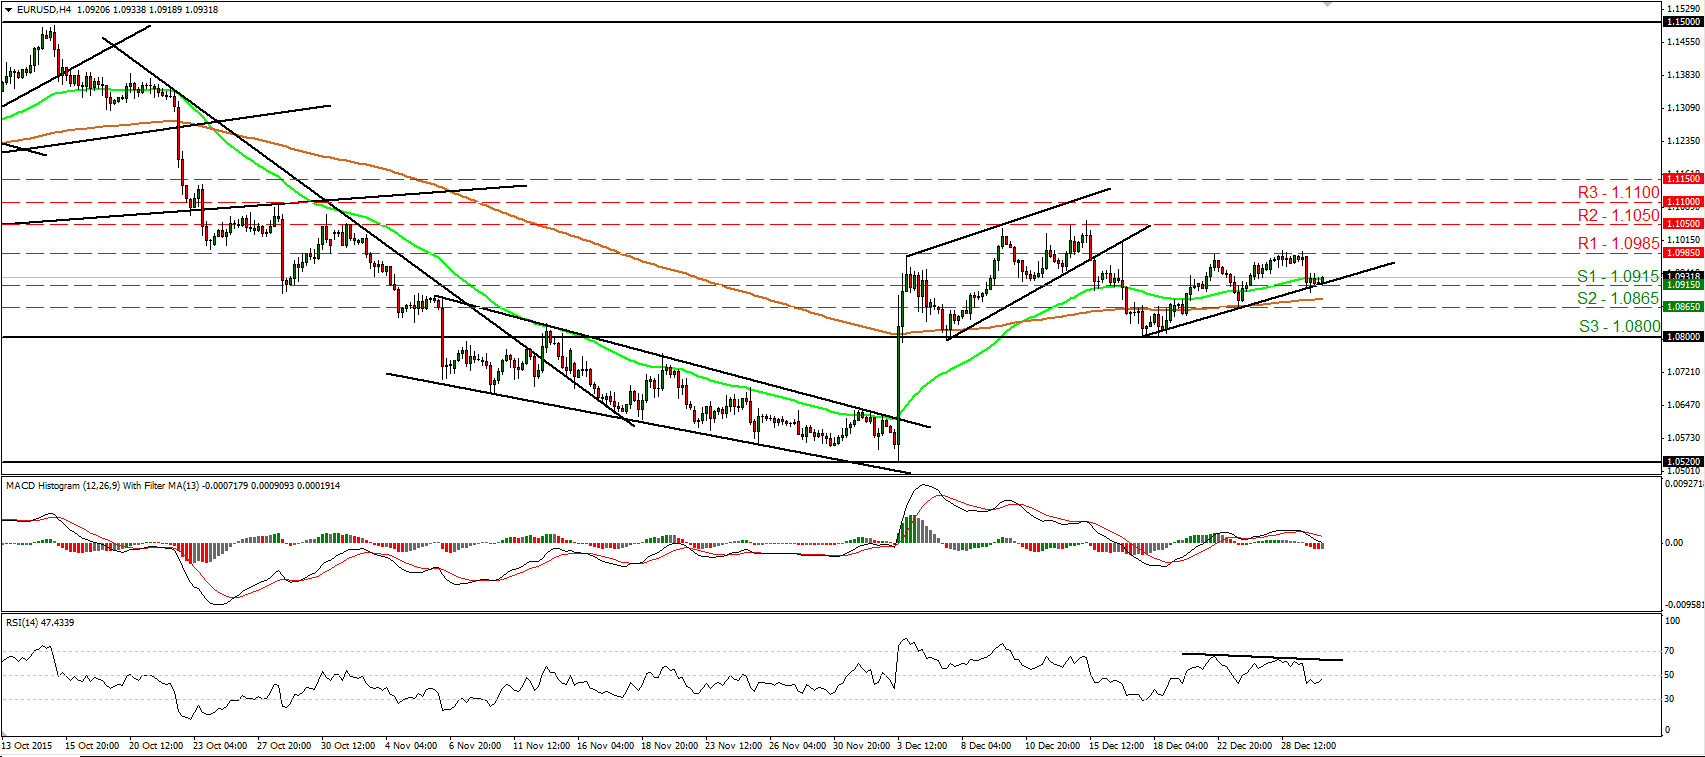
• EUR/USD tumbled yesterday after it traded for two consecutive days near the 1.0985 (R1) resistance hurdle. However the decline was stopped slightly below the 1.0915 (S1) level, near the upside support line taken from the low of the 17th of December. Given the inability of the bulls to overcome the 1.0985 (R1) resistance zone, I will switch my stance to neutral for now. I believe that a break above that resistance is needed to set the stage for more bullish extensions, perhaps towards the next obstacle area of 1.1050 (R2). Looking at our oscillators, I see that the RSI turned up again and looks able to move back above 50, while the MACD stands below its trigger, points down and appears ready to turn negative. These mixed momentum signs are another reason I prefer to stay flat for now. Switching to the daily chart, I see that on the 7th and 17th of December, the rate rebounded from the 1.0800 key hurdle, which is also the lower bound of the range it had been trading from the last days of April until the 6th of November. As a result, I prefer to maintain a neutral stance as far as the overall outlook is concerned as well.
• Support: 1.0915 (S1), 1.0865 (S2), 1.0800 (S3)
• Resistance: 1.0985 (R1), 1.1050 (R2), 1.1100 (R3)
EUR/GBP hits resistance slightly below 0.7415
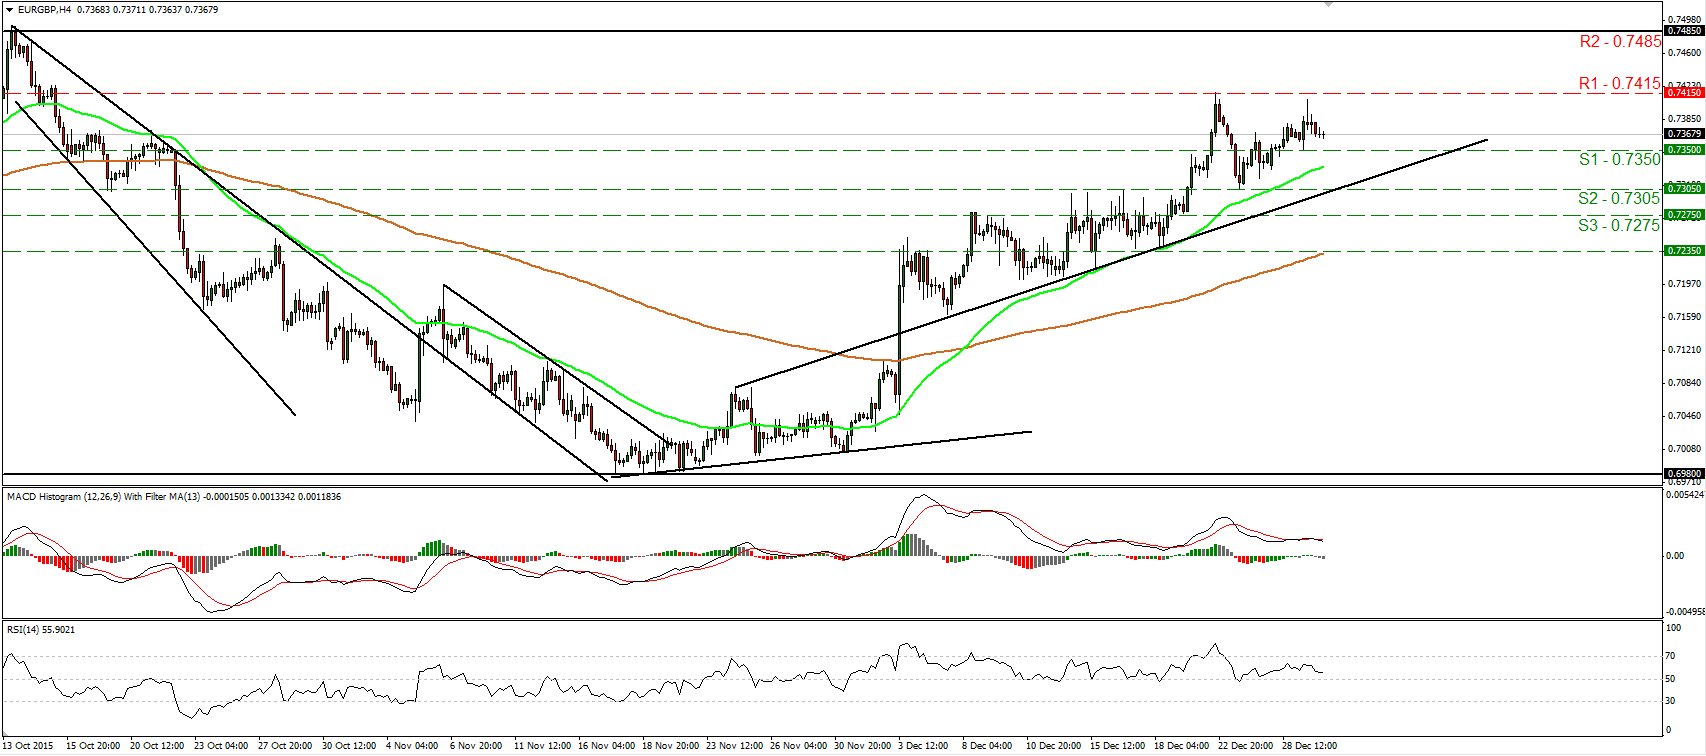
• EUR/GBP slid on Tuesday after it hit resistance slightly below the 0.7415 (R1) resistance hurdle. As long as the rate is trading above the short-term uptrend line taken from back the low of the 7th of December, the short-term bias remains to the upside in my view. However, I prefer to see a decisive move above 0.7415 (R1) before I get confident again on further advances. Such a move would confirm a forthcoming higher high on the 4-hour chart and perhaps aim for the next resistance zone of 0.7485 (R2). For now, given the inability of the rate to overcome 0.7415 (R1), I believe that yesterday’s retreat is likely to continue for a while. A break below 0.7350 (S1) could confirm that and perhaps extend the setback towards the aforementioned uptrend line or the 0.7305 (S2) line. Our short-term oscillators support the notion as well. The RSI turned down again, while the MACD, although positive, has topped and fallen below its trigger line. What is more, there is negative divergence between both these indicators and the price action. Switching to the daily chart, I see that the rate has been trading within a wide sideways range between the 0.6980 support area and the resistance zone of 0.7485 (R3). As a result, although I see a near-term uptrend, I would like to hold a “wait and see” stance as far as the overall outlook of this pair is concerned.
• Support: 0.7350 (S1), 0.7305 (S2), 0.7275 (S3)
• Resistance: 0.7415 (R1), 0.7485 (R2), 0.7500 (R3)
NZD/USD slides after finding resistance at 0.6880
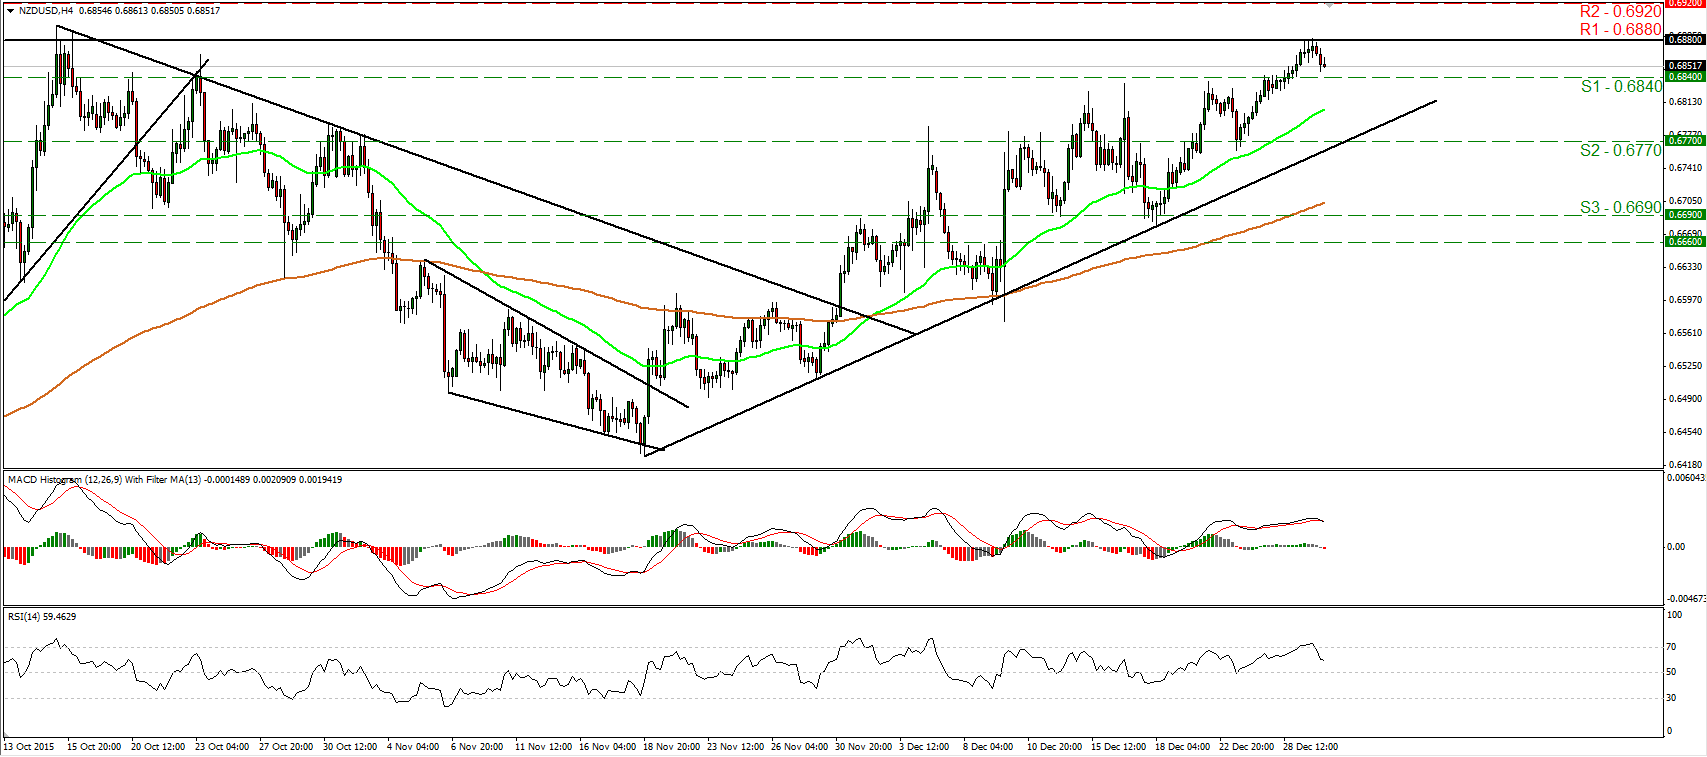
• NZD/USD traded lower on Tuesday after it found resistance at the 0.6880 (R1) barrier. Bearing in mind that the rate is printing higher peaks and higher troughs above the uptrend line taken from the 18th of November, I would consider the short-term outlook to still be positive. Nevertheless, I see signs that the current setback may continue for a while before buyers decide to take the reins again. A decisive dip below 0.6840 (S1) is likely to confirm the case and perhaps see scope for extensions towards the 0.6770 (S2) area. Our momentum studies support the notion as well. The RSI edged down after it exited its above-70 territory, while the MACD, although positive, has topped and fallen below its trigger line. On the daily chart, I see that on the 18th of November, the rate formed a higher low. However, I believe that a clear close above 0.6880 (R1) is the move that would confirm a forthcoming higher high and perhaps turn the medium-term picture positive.
• Support: 0.6840 (S1), 0.6770 (S2), 0.6690 (S3)
• Resistance: 0.6880 (R1), 0.6920 (R2), 0.7000 (R3)
Gold stays near the 1068 support
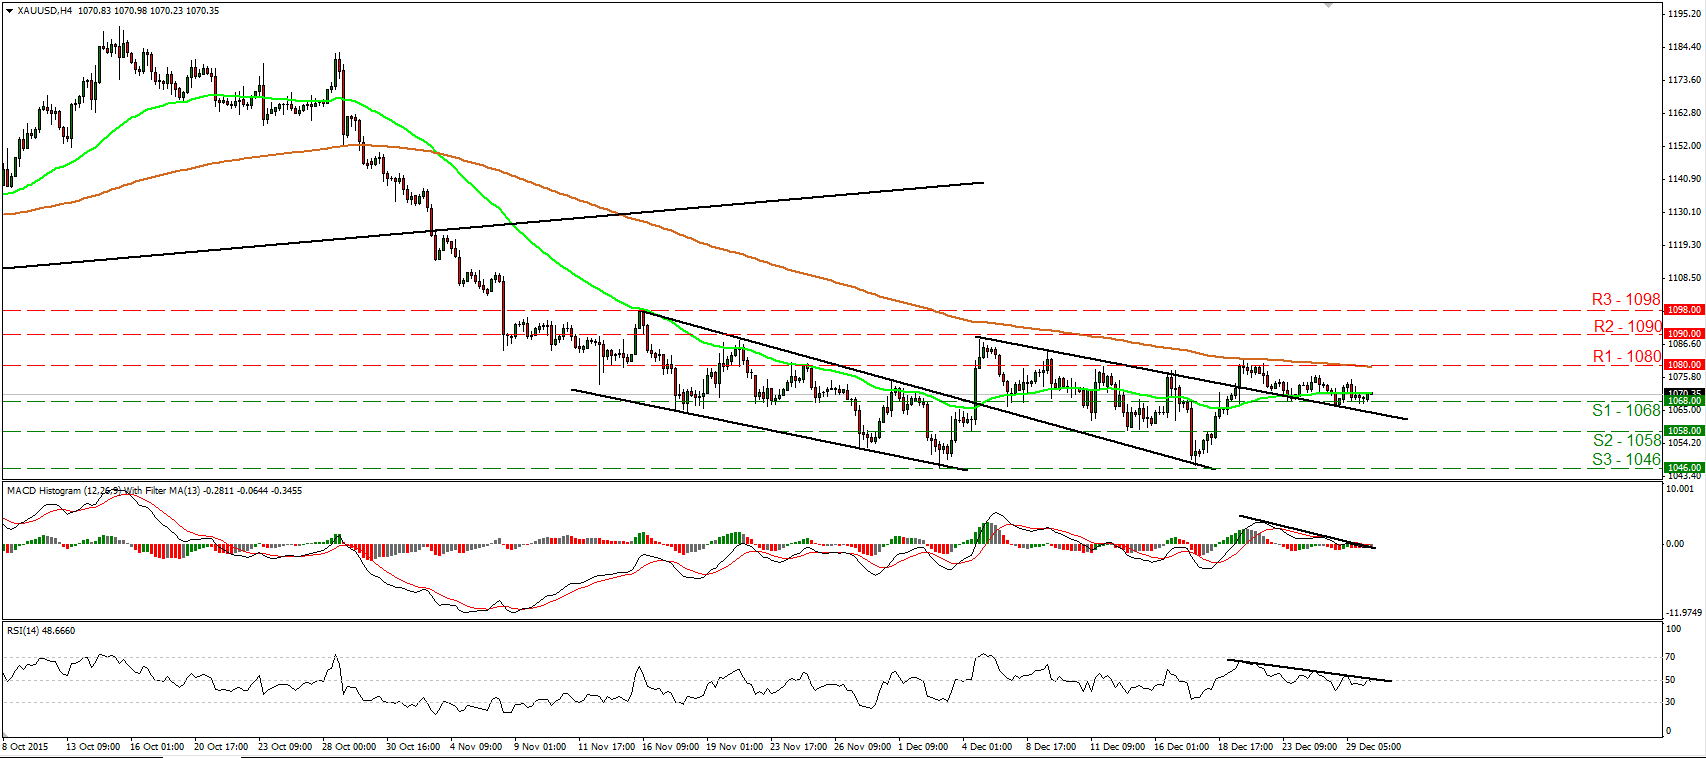
• Gold continued trading in a quiet mode, staying slightly above the 1068 (S1) support line. The metal lies between that support and the 1080 (R1) resistance zone, and although it lies above the prior downtrend line drawn from the peak of the 4th of December, I prefer to see a clear move above 1080 (R1) before I get more confident on the upside. Something like that could aim for the 1090 (R2) area, defined by the peaks of the 20th of November and 4th of December. Looking at our short-term momentum studies, I see that they both stand near their neutral levels, confirming the quiet mode of the yellow metal. These signs are another reason I would prefer to see a break above 1080 (R1) before trusting further short-term advances. As for the broader trend, a decisive close above 1090 (R2) is likely to signal the completion of a double bottom formation on the daily chart and could turn the medium-term outlook to the upside. For now, I stay flat as far as the longer-term picture is concerned.
• Support: 1068 (S1), 1058 (S2), 1046 (S3)
• Resistance: 1080 (R1), 1090 (R2), 1098 (R3)
WTI hits once again the 38.00 barrier
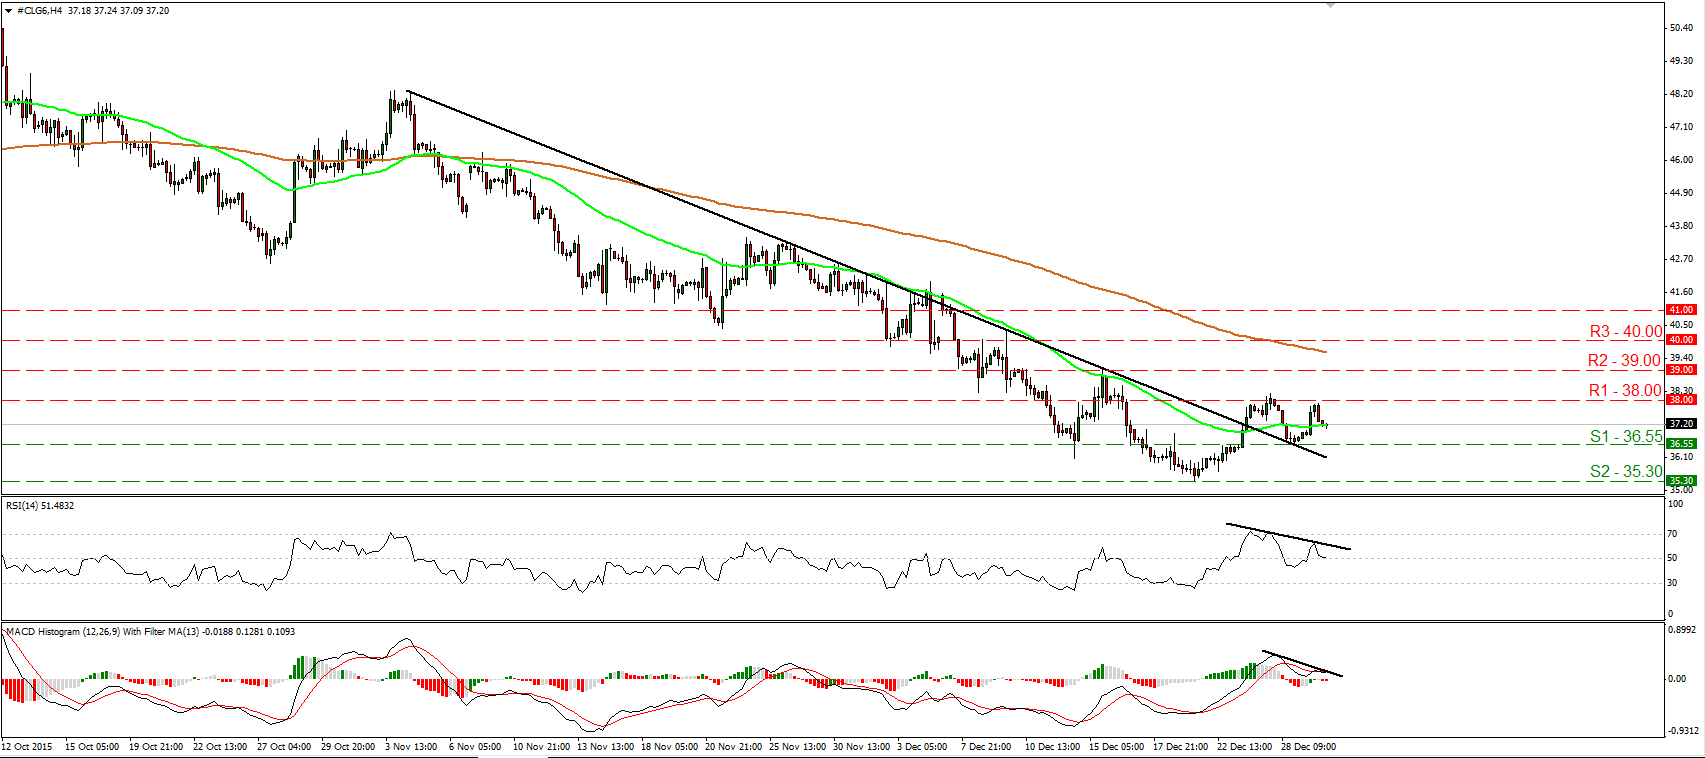
• WTI traded higher yesterday, but the advance was stopped once again by the 38.00 (R1) barrier and then the price retreated again. Although WTI is trading above the downtrend line taken from the peak of the 4th of November, the fact that buyers failed to overcome the 38.00 (R1) zone makes me believe that the current slide is likely to continue. I believe that a break below 36.55 (S1) is the move that would extend the negative move and perhaps aim for another test at the 35.30 (S2) line, marked by the low of the 21st of December. Our short-term oscillators corroborate my view as well. The RSI turned down and is now testing its 50 line, while the MACD, although positive, has fallen below its signal line. There is also negative divergence between both the indicators and the price action. On the daily chart, I see that WTI has been printing lower peaks and lower troughs since the 9th of October. As a result, I would consider the longer-term picture to stay negative and I would treat the recovery from 35.30 (S2) as a retracement of that negative medium-term downtrend.
• Support: 36.55 (S1), 35.30 (S2), 35.00 (S3)
• Resistance: 38.00 (R1), 39.00 (R2), 40.00 (R3)


