Brexit: 3 charts to watch
- UK goes to polls starting 0600 UK time, June 23rd
- Polling expected to be completed by 2200 UK time
- No official exit polls have been commissioned, leaving GBP vulnerable to rumors
- Official results will be announced on June 24th, 0800 UK time
- GBP looks bullish overall, but there are equal technical signs of a bearish move as well
Marking an end to months of campaigning for and against the EU membership, UK goes to polls today. At stake is whether the UK wishes to remain part of the EU or to give up its membership and most likely surrender its single market access as well.
Investors and businesses in the UK have remained wary of today's referendum outcome. Preliminary economic indicators pointed to uncertainty as businesses continued to scale back their investments, seeking more time until the clouds of uncertainty pass over.
However, since late May - early June, the UK's economy was already posting a turnaround, with manufacturing and industrial production rising while at the same time consumer sentiment was also high with a surge in retail sales, led by a strong wage growth.
As the polls open today, there will be no 'official' exit polls being released. At 2200 UK time, the polls close and counting is expected to start, with early result coming out later in the evening. Tomorrow, June 24th, at 0800 UK time, the official results will be published. This crucial 24 hours is likely to see a lot of volatility in the markets, with any critical news flows likely to swing the markets either way.
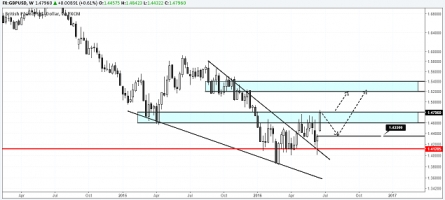
The pound sterling has already managed to make headway, with the GBP/USD seen trading $1.48 in early Asian session this morning. GBP/USD has formed a basing pattern near 1.46 and 1.388 over the past few months, and the current breakout above 1.46 shows initial signs of a move to the upside.
The next main resistance in GBP/USD comes in at 1.50 and 1.52. Despite the early rally, the price action is not yet convincing for the moment and it is likely that GBP/USD could see some wild swings in either direction, picking up pace later tonight.
The weekly chart on GBP/USD shows prices breaking out of the falling wedge pattern and currently struggling near the resistance of 1.46 - 1.48. A breakout above 1.48 could see GBP/USD extend its gains towards 1.52 - 1.54 resistance level.
There is however a risk of prices pulling back to 1.435, where an unfilled gap is most likely to be retested and filled. The bullish bias remains invalidated if GBP/USD closes below 1.4120, in which case we could expect the cable to post new lows.
While there are no clear patterns emerging on the charts, GBP/USD does show hints of bullish price action.
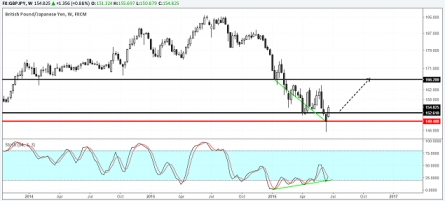
GBP/JPY, another currency pair that is likely to see a lot of volatility, has formed a bullish divergence on the weekly chart, with the Stochastics posting a higher low against price's lower low. Clearing above 152.61 could see GBP/JPY correct to the upside towards 166.20 at the minimum. To the downside, a weekly close or a bearish pattern below 149.40 could see GBP/JPY push lower.
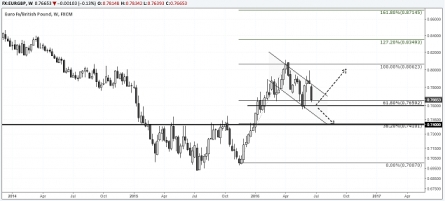
EUR/GBP has been retreating following the strong rally to 0.806 levels. The weekly chart shows a shooting star pattern, which could be validated on a weekly bearish close. Support is seen at 0.7660 - 0.760 level, which could see the bullish flag consolidation breakout to the upside, targeting 0.806 and to 0.87.
Alternately, a bearish break below 0.766 - 0.76 could send EUR/GBP lower to test the inverse head and shoulders neckline resistance at 0.740 - 0.741, which could be tested for support.


