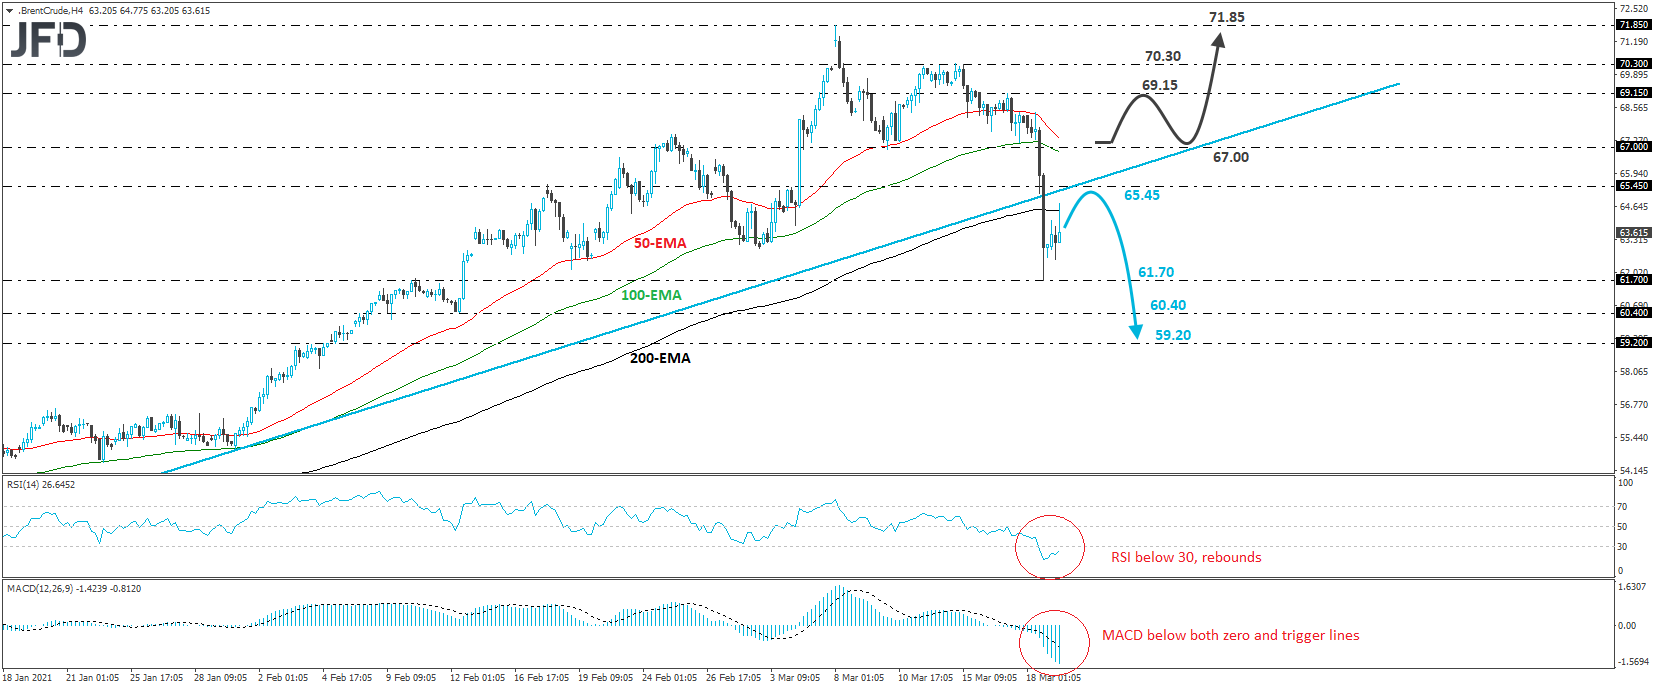
Brent crude oil fell sharply on Thursday, initially breaking below the 67.00 zone and completing a failure swing top pattern, and then, below the upside support line drawn from the low of Nov. 2. The tumble also took the black liquid below all of our moving averages on the 4-hour chart. In our view, all these technical signs suggest that the short-term outlook has turned negative.
The fall was stopped by the 61.70 barrier, and then, the price rebounded. However, it remains below the aforementioned upside line, and even if it trades a bit higher, there is a decent chance for the bears to jump in near the 65.45 zone and push the price down for another test near 61.70. If that level is broken this time around, a forthcoming lower low would be confirmed and we may experience extensions towards the low of Dec.12, at 60.40, or the low of Dec. 5, at 59.20.
Shifting attention to our short-term oscillators, we see that the RSI, although still within its below-30 zone, has turned up, while the MACD lies below both its zero and trigger lines, but shows signs that it could also turn up soon. Both indicators detect slowing downside speed, which supports the idea of some further recovery before the next leg down.
That said, in order to abandon the bearish case, we would like to see a recovery back above 67.00. This will also take the price back above the upside support line and may initially target Wednesday’s peak, at 69.15. Another break, above 69.15, could pave the way towards the 70.30 zone, which provided strong resistance on Monday. If that hurdle is not able to halt the advance either, then the next stop may be at 71.85, marked by the high of Mar. 8.