Yesterday, the 10-year Treasury yield closed at 3.16% and depending on the source you listen to, 3.16% represents the highest yield since 2011 or 2008.
- The previous 10-year Treasury yield high for 2018 was the high tick of 3.115% on May 17, 2018.
- Prior to the May 17th high tick, the highest yield the 10-year Treasury hit was way back on January 6th, 2014 when the 10-year struck 3.04%.
- Before that early 2014 date, July 11th, 2011, saw the 10-year Treasury yield trade up to 3.22%.
The 10-year Treasury yield bottomed at 1.33% and 1.36% in July, 2012 and then July, 2016 right around the Brexit vote in the UK.
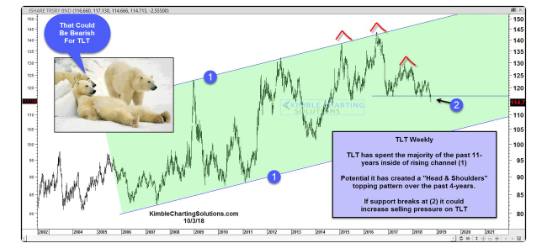
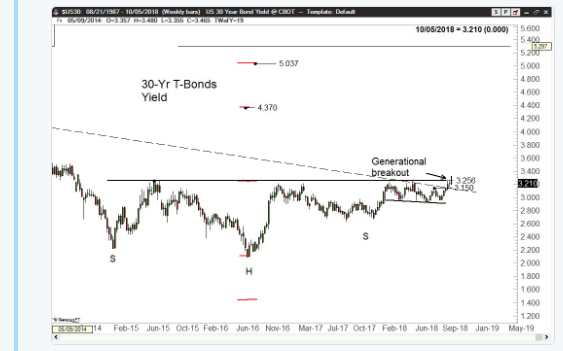
The first chart is Chris Kimble’s strong technical work, while Peter Brandt posted this “generational breakout” in the 30-year Treasury yield today on Twitter.


Summary / Conclusion: Jeff Gundlach, the new bond king of the last 10 years, has always warned publicly that two closes above 3.26% for the 30-year Treasury would constitute a significant breakdown for the Treasury maturity, so yesterday’s close of 3.31% is important.
The 30-year Treasury does not have the same cachet it did back in the 1980’s and 1990’s. It seems more weight is given to the 10-year Treasury maturity today, but both are still worth watching.
Treasury yields are climbing on faster economic growth rather than any signs of inflation.
Maybe Amazon (NASDAQ:AMZN) has put the fear of God in the bond market with their self-imposed $15 minimum wage for all workers just announced this week. I can’t recall the source but Amazon has possibly added more workers than any other company in America in the last 5 years. It is certainly one of the fastest growing companies when measured by workforce expansion today as detailed by Business Insider here.
Today, (Thursday, October 4th, 2018) investors and market watchers see jobless claims and then on Friday we get the all-important September ’18 jobs report. Yesterday’s September ADP report showed +230,000 “net new” private sector jobs created by the US economy, which is well above the 180,000 consensus for the private sector expected in the monthly labor report due out at 7:30 am Friday, October 5th, 2018.
Remember too, the US economy is 80% services and this morning’s “services” purchasing managers report was stronger-than-expected too.
Homebuilder stocks continued to decline yesterday. Lennar (NYSE:LEN) printed above $70 in January ’18, but closed at $46 today after a decent earnings report. Toll Brothers (NYSE:TOL) the high end homebuilder, saw a $55 print in January ’18, and is trading now at $32.
The valuations on both these homebuilders are getting attractive. The problem is that the rise in Treasury and mortgage rates could just be starting.
For the 10- and 30-year Treasuries watch where yields and prices close the week.
