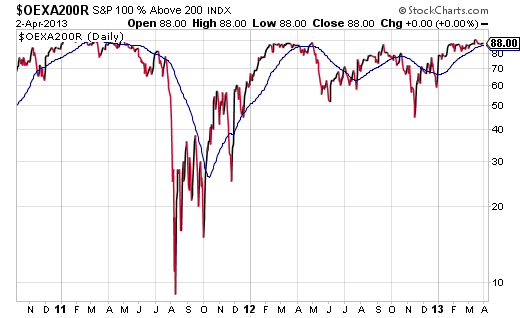
Over the course of the 4-year bull market, I’ve kept an eye on the percentage of S&P 100 stocks that reside above a long-term 200-day trendline. Market pressures always seemed to develop when the level approached 86%-90%. Similarly, when the 50-day moving average for the S&P 100 reached 85%, you could pretty much count on a pullback coming to fruition.

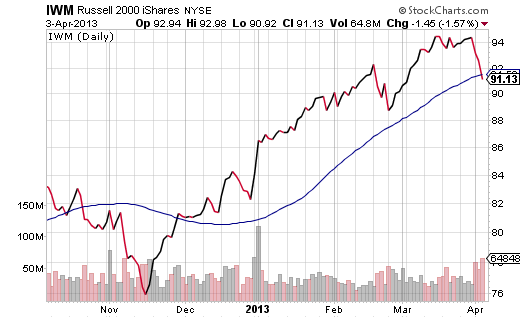
In spite of the fact that the Dow 30 logged a fresh all-time record on Tuesday (4/02/13), Wednesday’s 1% sell-off for U.S. large-caps may be part of a broader correction. In fact, the iShares Russell 2000 (IWM) has already broken below a closely watched technical level; that is, the prominent U.S. small cap tracker hadn’t breached its 50-day to the downside since October.

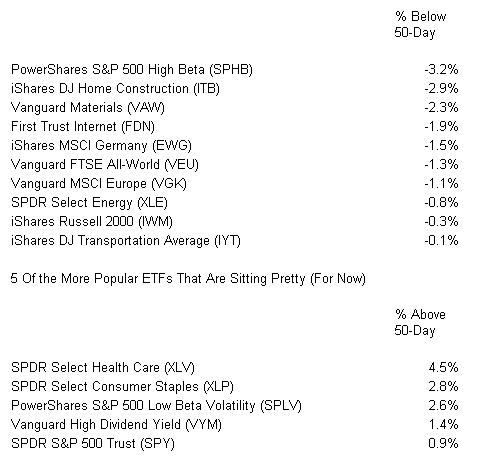
Perhaps surprisingly, there are hundreds of unleveraged exchange-traded vehicles that currently sit below a 50-day. And while some folks dismiss the intermediate-term trendline and technical analysis altogether, others find value in the data. For this reason, I am choosing to bring to light several key ETFs that have broken below “support.”
Ten Of The More Popular ETFs That Have Broken Through Technical Support

In my assessment, the implications are relatively straightforward. Investors are beginning to balk at the idea that the economy is strengthening — either domestically or globally. They may gravitate toward safe equity positions — non-cyclical large companies listed on U.S. exchanges. Yet they’re backing away from cyclical segments (e.g., materials, energy, tech, etc.), small companies and foreign stocks.
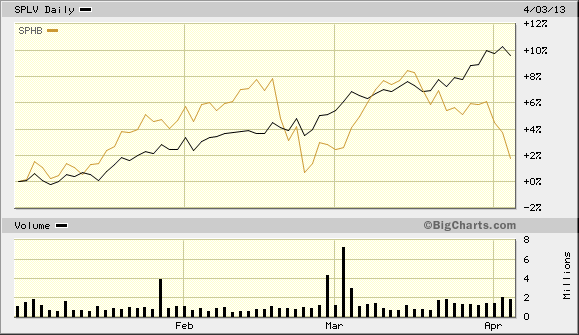
Perhaps the most potent example of where the investor mindset is can be found in two opposing PowerShares products: PowerShares S&P 500 Low Beta Volatility (SPLV) and PowerShares S&P 500 High Beta (SPHB). The former is chock-full of sectors that are less tied to expansions and contractions, including utilities, health care, telecom and consumer staples. The latter is flanked by financials, tech, energy and industrials. And right now, SPLV is noticeably outpacing SPHB.

Disclosure: Gary Gordon, MS, CFP is the president of Pacific Park Financial, Inc., a Registered Investment Adviser with the SEC. Gary Gordon, Pacific Park Financial, Inc, and/or its clients may hold positions in the ETFs, mutual funds, and/or any investment asset mentioned above. The commentary does not constitute individualized investment advice. The opinions offered herein are not personalized recommendations to buy, sell or hold securities. At times, issuers of exchange-traded products compensate Pacific Park Financial, Inc. or its subsidiaries for advertising at the ETF Expert web site. ETF Expert content is created independently of any advertising relationships.

In spite of the fact that the Dow 30 logged a fresh all-time record on Tuesday (4/02/13), Wednesday’s 1% sell-off for U.S. large-caps may be part of a broader correction. In fact, the iShares Russell 2000 (IWM) has already broken below a closely watched technical level; that is, the prominent U.S. small cap tracker hadn’t breached its 50-day to the downside since October.

Perhaps surprisingly, there are hundreds of unleveraged exchange-traded vehicles that currently sit below a 50-day. And while some folks dismiss the intermediate-term trendline and technical analysis altogether, others find value in the data. For this reason, I am choosing to bring to light several key ETFs that have broken below “support.”
Ten Of The More Popular ETFs That Have Broken Through Technical Support

In my assessment, the implications are relatively straightforward. Investors are beginning to balk at the idea that the economy is strengthening — either domestically or globally. They may gravitate toward safe equity positions — non-cyclical large companies listed on U.S. exchanges. Yet they’re backing away from cyclical segments (e.g., materials, energy, tech, etc.), small companies and foreign stocks.
Perhaps the most potent example of where the investor mindset is can be found in two opposing PowerShares products: PowerShares S&P 500 Low Beta Volatility (SPLV) and PowerShares S&P 500 High Beta (SPHB). The former is chock-full of sectors that are less tied to expansions and contractions, including utilities, health care, telecom and consumer staples. The latter is flanked by financials, tech, energy and industrials. And right now, SPLV is noticeably outpacing SPHB.

Disclosure: Gary Gordon, MS, CFP is the president of Pacific Park Financial, Inc., a Registered Investment Adviser with the SEC. Gary Gordon, Pacific Park Financial, Inc, and/or its clients may hold positions in the ETFs, mutual funds, and/or any investment asset mentioned above. The commentary does not constitute individualized investment advice. The opinions offered herein are not personalized recommendations to buy, sell or hold securities. At times, issuers of exchange-traded products compensate Pacific Park Financial, Inc. or its subsidiaries for advertising at the ETF Expert web site. ETF Expert content is created independently of any advertising relationships.
