Forex News and Events
Brazil unemployment rate is due today and median forecast shows that it is expected to rise for the fourth straight month to 6.3% from 6.2% in March as the economy is expected to contract 1.2% this year, according to survey provided by the BCB. The Brazilian economy is in a tough spot as economists see further contraction in the near term while growth may come back in the medium term but will be highly dependent on the implementation of much needed reforms. On Tuesday, Chinese Premier Li Keqiang lifted the veil on a $53 billion investment deal with Brazil during its first visit to Latin America. The deal will allow the world’s seventh biggest economy, which is experiencing fiscal and monetary tightening, to take a breather.
In its fight against elevated inflation, the BCB already increased the Selic rate two times this year and we expect another rate hike by 25bps to 13.50% at the June meeting. On the inflation front, IPCA inflation is due tomorrow and is expected to drop at 0.59%m/m in May from 1.07% in April. However, the weakness of the dollar over the last three months has helped the BCB to fight inflation. Nevertheless, this effect will fade away as soon as the US economy recovers, allowing the greenback to resume its rally and driving inflation higher in Brazil.
USD/BRL is moving sideways since early May and is currently heading back to the strong support standing around 2.9748. On the upside, the pair will find a resistance at 3.0897, then 3.2877.
US data eyed
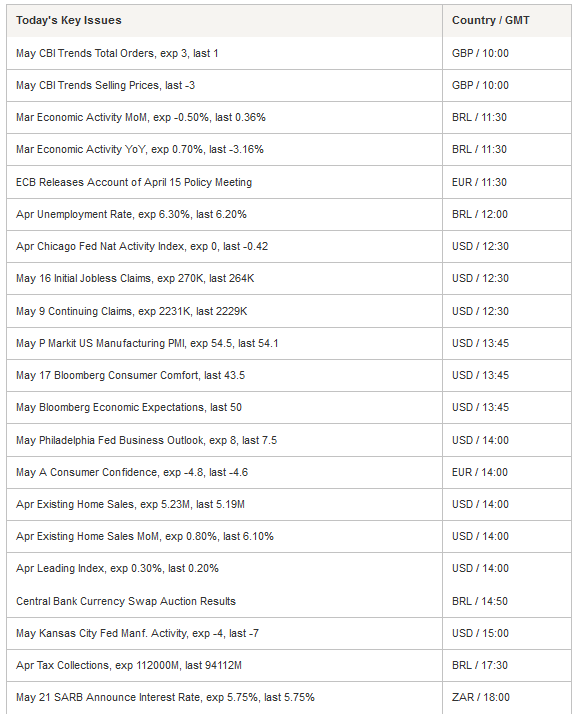
The fresh batch of US data due this afternoon will be key to confirm the good housing data release earlier this week and thereby validate whether the US economy weakness is temporary. Initial jobless claims are expected at 270k (264k prior), Markit Manufacturing PMI at 54.5 (54.1 prior), Philadelphia Fed Business Outlook at 8 (7.5 prior), Existing Home Sales at 5.23m (5.19 prior) and finally Leading Index at 0.3% (0.2% prior).
SARB between high inflation and low growth (by Yann Quelenn)
Today the South-African Reserve Bank (SARB) will announce its decision regarding its repo rate. Since 2013, it has increased gradually from 5% and to 5.75% now. The reserve bank is now in front of a dilemma because inflation is rising back towards its 2014 level of around 6%. Yesterday’s CPI figure came in at 4.5% y/y for April vs prior February figure of 3.9% y/y. The rebound in oil prices had a significant effect on inflation and the low oil prices effect is now vanishing. Furthermore, strong dollar rally in the past 6 months made the ZAR much weaker and therefore pushes inflation higher.
In addition of an upside risk for interest rate due to inflation, the South African growth is now at stake. Retails sale eased by a half point m/m. Uncertainties on the South African economy is likely to make the central bank to react. It is worth adding that 2% growth forecast for this year is far below the level required to ease high unemployment. This is why we think that rates are likely to remain unchanged. USD/ZAR is trading between 11.8092 and 11.8897. A change in the rate would continue weakening the pair.
GBP/USD - Monitoring the rising trendline


The Risk Today
Yann Quelenn
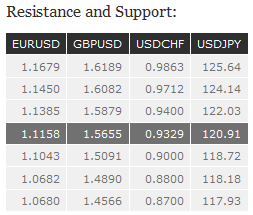
EUR/USD is consolidating around 1.1131 (12/05/2015 low) and is monitoring the support at 1.1066 (05/05/2015 low). Resistances lies at 1.1217 (19/05/2015 high) and (1.1459 (15/05/2015 high). In the longer term, the symmetrical triangle from 2010-2014 favors further weakness towards parity. As a result, we view the recent sideways moves as a pause in an underlying declining trend. Key supports can be found at 1.0504 (21/03/2003 low) and 1.0000 (psychological support). Break to the upside would suggest a test of resistance at 1.1534 (03/02/2015 reaction high).
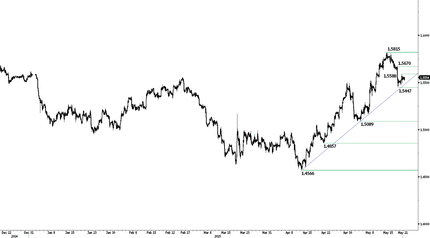
GBP/USD is approaching the rising trendline at around 1.5500 initiated mid-April. Support can be found at 1.5447 (19/05/2015 low). Key resistance lies at 1.5815 (14/05/2015 high). In the longer term, the technical structure looks like a recovery bottom whose maximum upside potential is given by the strong resistance at 1.6189 (Fino 61% entrancement). The current upwards consolidation suggests a medium-term persistent buying interest as long as support as 1.5380 holds.
USD/JPY is holding below the resistance at 121.85 (10/03/2015 high) and remains above the support at 118.33 (20/02/2015 low). The pair is still bullish as we stay above the 200-dma. Hourly resistance is given by 121.48 (20/05/2015 high). A long-term bullish bias is favored as long as the strong support at 115.57 (16/12/2014 low) holds. A gradual rise towards the major resistance at 124.14 (22/06/2007 high) is favored. A key support can be found at 118.18 (16/02/2015 low), whereas a key resistance stands at 121.85 (see also the long-term declining channel).
USD/CHF remains in a range and is now monitoring the resistance at 0.9414 (05/05/2015 high). In the mid-term, the pair remains bearish on a declining channel. Key support lies at 0.9073 (07/05/2015 low) and around 0.8900 (declining trendline). In the long-term, there is no sign to suggest the end of the current downtrend. After failure to break above 0.9448 and reinstate bullish trend. As a result, the current weakness is seen as a counter-trend move. Key support can be found 0.8986 (30/01/2015 low).

