Forex News and Events:
The poor economic data out of the US increase popularity of carry trades, as the cheap liquidity conditions sustained by the Fed are expected to last longer. Among the EM currencies, the Brazilian real is certainly one of the favorite carry-long-legs, not only because the BCB prepares for Fed normalization by consequent policy rate hikes since last year, but also because of its commitment to sustain the real directly. Real trades at a month highs against the USD as the central bank pledged to support the currency at least until December 31st by offering 200 million US dollar worth swaps for every business day. Brazil’s determination to fight its above-the-target inflation (6.37% y/y in May versus 4.5% y/y target +/- 2%) increase carry strategists’ appetite in BRL and more importantly tempers the volatility risk should the international capital flows reverse. In fact, Brazil’s Selic rate is at least twice more than its rate-setting Latin American peers. There is no secret for carry-lovers; BRL is the place to be.
TRY, RUB opportunities require solid nerves
The favorable carry environment benefit to lira and ruble as both currencies offer interesting returns due to higher rates implemented on several internal and/or external political and geopolitical issues. The carry spreads are thus motivating for long TRY and RUB positions (vs. USD, CHF, JPY and EUR), however the risk carried through these currency holdings are somewhat elevated due to ongoing uncertainties. At the end of the day, the carry spread is nothing but a small portion of the carry trade returns, the most important issue is to make sure that the long-leg exposure of the strategy doesn’t wipe out gains through inevitable periods of carry unwinds.
The reason why we analyze TRY and RUB under the same title, is mostly due to the similar risk/rate history they have been recently subject to. Both countries’ central banks proceeded with surprise and significant rate action in 2014 after their respective currencies depreciated to unsustainable levels due to numerous endo/exogenous factors. However today, the risk/reward picture diverges partially due to escalating tensions in Iraq.
In Turkey, the ruling government AKP is by hook or by crook persistent for lower interest rates (and the central bank is somehow obedient perhaps to avoid any political conflict with such governmental power). This is a risk for the Turkish rate spread as further rate cuts seem to be underway. Combined to the geopolitical turmoil in Iraq, the proximity and the high implication of Turkey across its eastern border and the threat on its oil imports, the lira risk adds to carry-spread risk. Hence, we conclude that the total TRY-carry-risk is getting relatively disproportionate compared to expected returns.
Obviously the situation is transposed for the energy-exporter Russia. Although the ruble is still subject to heavy geopolitical tensions in Ukraine and decent political pressure from the EU and US, the tensions in Iraq certainly appear at the right time for Russia. After record low levels recorded against USD and EUR on March (Crimea referendum), the ruble remains meaningfully below its past 5-year averages on both decks. Today, this depreciation gives advantage to long-RUB bets, first because technically the USD/RUB broad uptrend channel bottom (building since April 2011) stand at the distant 32.00 levels, thus giving the RUB sizeable room for further recovery (appreciation). Second, and most importantly, the Iraqi crisis is no more considered as a temporary, local conflict and thus should certainly weigh on global oil supply in the mid-run. The relatively cheap ruble and sustained demand for Russian oil is a safety bag for drastic ruble depreciation.

Today's Key Issues (time in GMT):
2014-06-26T12:30:00 CAD Apr Average Weekly Earnings YoY, last 3.10%2014-06-26T12:30:00 USD Jun 21st Initial Jobless Claims, exp 310K, last 312K
2014-06-26T12:30:00 USD Jun 14th Continuing Claims, exp 2560K, last 2561K
2014-06-26T12:30:00 USD May Personal Income, exp 0.40%, last 0.30%
2014-06-26T12:30:00 USD May Personal Spending, exp 0.40%, last -0.10%
2014-06-26T12:30:00 USD May PCE Deflator MoM, exp 0.30%, last 0.20%
2014-06-26T12:30:00 USD May PCE Deflator YoY, exp 1.80%, last 1.60%
2014-06-26T12:30:00 USD May PCE Core MoM, exp 0.20%, last 0.20%
2014-06-26T12:30:00 USD May PCE Core YoY, exp 1.60%, last 1.40%
2014-06-26T15:00:00 USD Jun Kansas City Fed Manf. Activity, exp 10, last 10
2014-06-26T16:00:00 EUR May Total Jobseekers, exp 3370.0k, last 3364.1k
2014-06-26T16:00:00 EUR May Jobseekers Net Change, exp 6, last 14.8
The Risk Today:
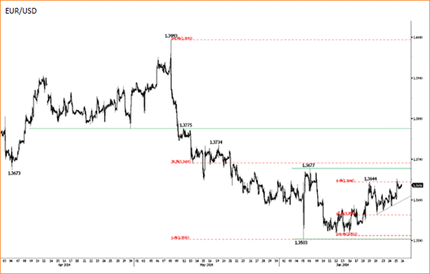
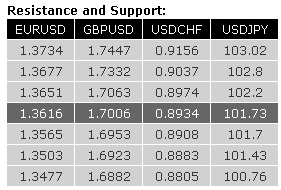
EUR/USD continues to grind higher within the horizontal range defined by 1.3503 and 1.3677. Monitor the test of the hourly resistance at 1.3644. An hourly support lies at 1.3565 (20/06/2014 low, see also the 61.8% retracement). In the longer term, the break of the long-term rising wedge (see also the support at 1.3673) indicates a clear deterioration of the technical structure. The long-term downside risk implied by the double-top formation is 1.3379. Key supports can be found at 1.3477 (03/02/2014 low) and 1.3296 (07/11/2013 low).
GBP/USD has weakened after having failed to break the major resistance at 1.7043. A short-term correction is in place as long as prices remain below the hourly resistance at 1.7006 (intraday high, see also the declining trendline). A support stands at 1.6923 (18/06/2014 low, see also the 38.2% retracement). Another support can be found at 1.6882 (27/05/2014 high, see also the 50% retracement). In the longer term, an eventual break of the major resistance at 1.7043 (05/08/2009 high) is favoured as long as the support at 1.6693 (29/05/2014 low) holds. Other resistances can be found at 1.7332 (see the 50% retracement of the 2008 decline) and 1.7447 (11/09/2008 low).
USD/JPY is moving sideways despite the proximity of the support implied by the 200 day moving average (around 101.70). The persistent succession of lower highs (see the declining trendline) favours a bearish bias. Hourly resistances stand at 102.20 (20/06/2014 high) and 102.36. Other supports can be found at 101.43 and 100.76. A long-term bullish bias is favoured as long as the key support 99.57 (19/11/2013 low) holds. Monitor the support area provided by the 200 day moving average and 100.76 (04/02/2014 low). A break of the key resistance at 103.02 is needed to suggest the end of the current consolidation phase. A major resistance stands at 110.66 (15/08/2008 high).
USD/CHF has again successfully tested the support at 0.8908 (05/06/2014 low, see also the 38.2% retracement). However, the short-term succession of lower highs needs to be broken to signal exhaustion in the selling pressure. An hourly resistance stands at 0.8974 (61.8% retracement). A strong resistance area lies between 0.9012 and 0.9037. Another support lies at 0.8883. From a longer term perspective, the bullish breakout of the key resistance at 0.8953 suggests the end of the large corrective phase that started in July 2012. The long-term upside potential implied by the double-bottom formation is 0.9207. A key resistance stands at 0.9156 (21/01/2014 high).

