Stocks began to come off resistance areas well this week and work off the extremely overbought readings we saw the previous week but we remain quite overbought.
Stocks are setting up much better charts now and I’m starting to move into them and looking to buy much more in the week and weeks ahead.
2016 is shaping up to be a decent year in the end from the action I’m seeing in the charts.
The metals are acting great as well and looking more and more like a new uptrend is in the very early stages of taking off.

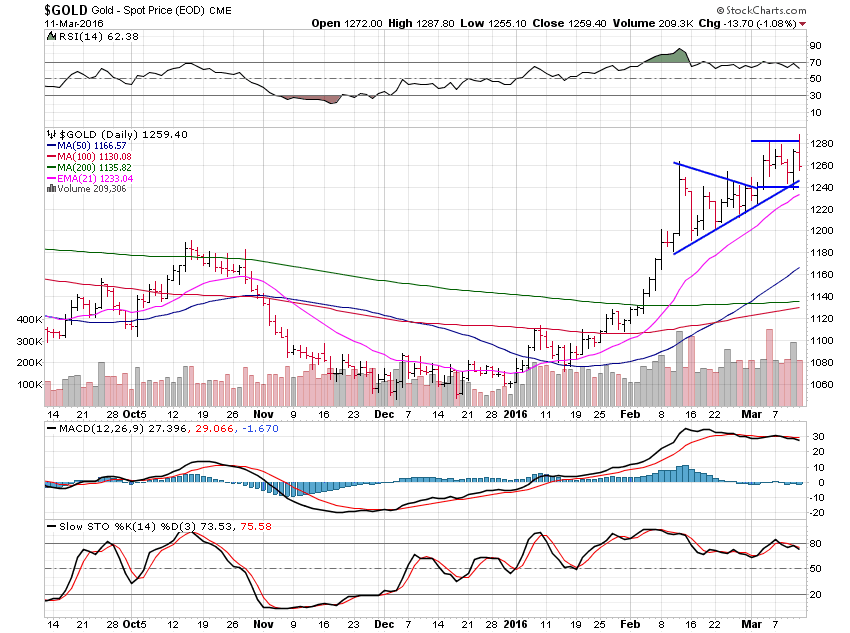
Gold spent the week mostly consolidating and setting up for higher and ended the week down just 0.06%
I’m not so thrilled to see the Friday failed breakout since if it can’t got higher, it often goes lower, but as long as we stay above $1,240, the next move will be higher.
A break above $1,280 remains the buy level with $1,420 coming in as the next major resistance level to watch for.
All in all, it looks like it’s time to grab some gold again, finally.
Now, I’ll have the perma-bulls back on my side but they’ve taken a ton of damage during this downtrend while I’ve been off making money in the leading sectors of the day.

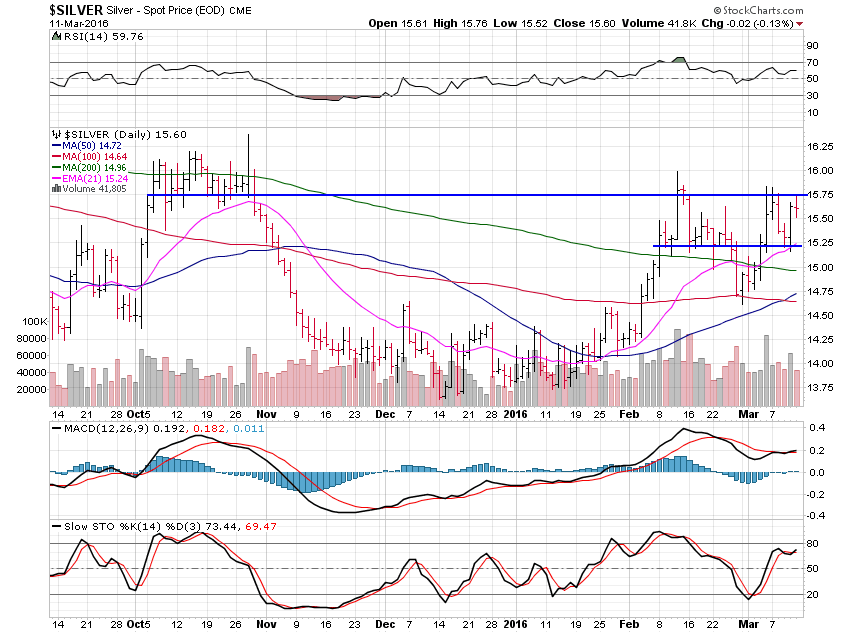
Silver gained 0.39% this past week and is also setting up well for a move higher.
Great action from silver who is showing strength and confirming the gold strength.
Great stuff that can see a breakout anytime now above the 15.75 buy level.
The weekly chart is showing me that the next resistance level is not until $18.25 so not a bad move coming up from this next breakout in the weeks ahead.
It can take up to 8 weeks to reach the next resistance level at $18.25.
All in all, great action that can see a move higher anytime now.

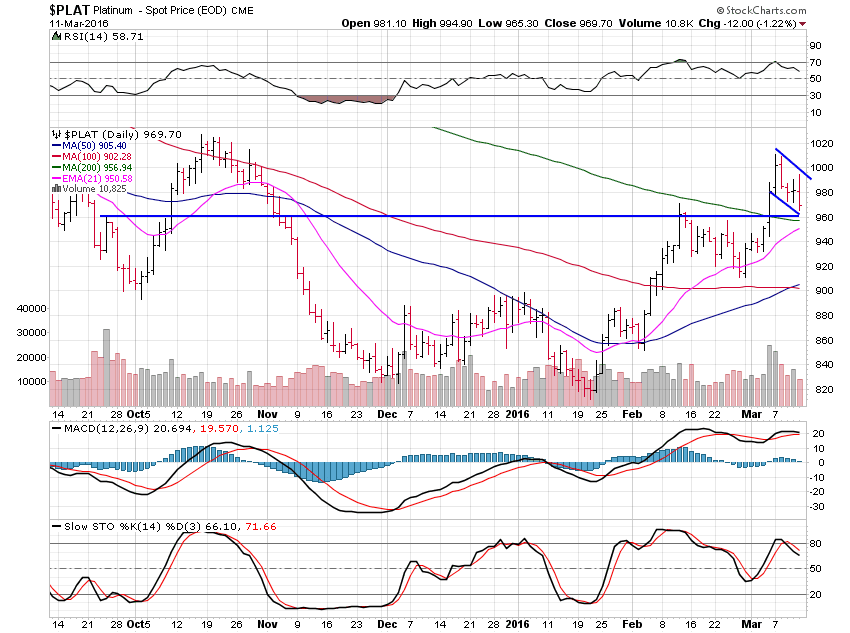
Platinum lost 1.15% and also looks great.
After a nice move, a week of rest is great to see.
We’re holding the $960 support level well and a break of this flag around $980 will be the next buy level.
Looking at the weekly chart I see $1,110 as the next resistance area to watch for.
Great action!

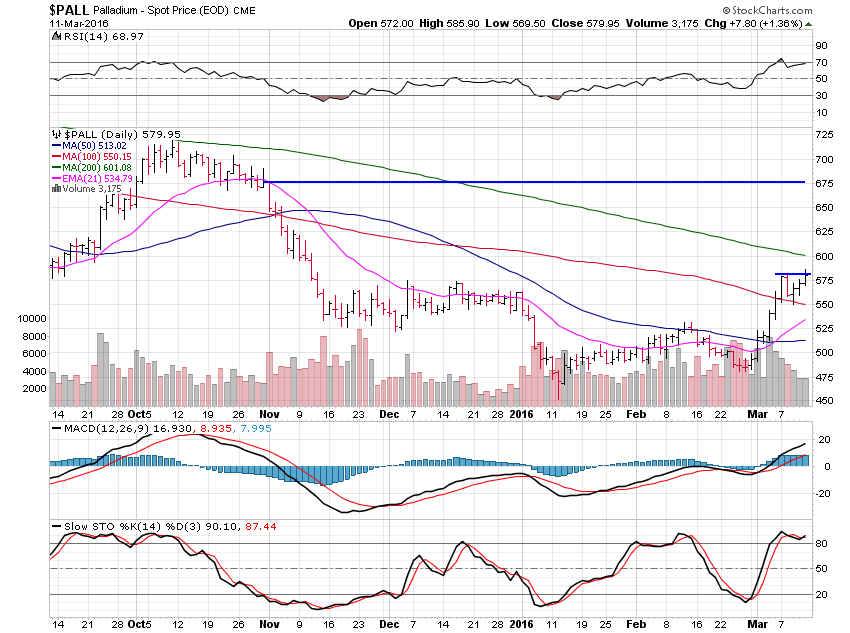
Palladium was the star rising 4.35% and still wanting more.
Palladium is acting great and the only area to watch as we move to the next resistance level way up at $675 is the 200 day moving average just above here.
We are resting very nicely here just below the 200 day moving average, which tells me it will have the power to break above said average and continue higher.
All in all, the metals are looking great and bottoms look to be solidly in place now while stocks are also setup to move much higher as 2016 chugs on.
It has been a very tricky first quarter and I really haven’t done a lot of trading since mid-December but I’m looking forward to doing more trading as setups permit.
A major key to this game is being able to identify what should, or shouldn’t be done, and just sitting and watching for a large part of the time.