Boston Properties, Inc. (NYSE:BXP) is expected to beat expectations when it reports second-quarter 2017 results on Aug 1, after the market closes.
Last quarter, this REIT, which mainly owns and develops Class A office real estates in the U.S., delivered lower-than-expected performance in terms of funds from operations (“FFO”) per share, witnessing a negative surprise of 1.33%. The company experienced a fall in rental revenues in the quarter.
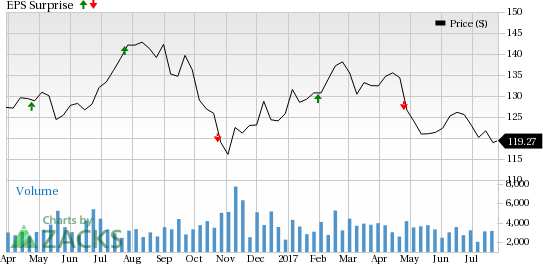
Nevertheless, Boston Properties has a mixed surprise history. In fact, the company exceeded estimates in two occasions for as many misses, over the trailing four quarters, resulting in an average positive surprise of 0.70%. This is depicted in the graph below:
Boston Properties lost 5.2% of its value, year to date, versus 3.4% growth of its industry.
Let’s see how things are shaping up for this announcement.
Why a Likely Positive Surprise?
Our proven model shows that Boston Properties is likely to beat estimates because it has the right combination of two key ingredients. A stock needs to have both a positive Earnings ESP and a Zacks Rank #1 (Strong Buy), 2 (Buy) or at least 3 (Hold) to beat estimates, and Public Storage (NYSE:PSA) has the right mix.
You can uncover the best stocks to buy or sell before they’re reported with our Earnings ESP Filter.
Zacks ESP: The Earnings ESP, which represents the percentage difference between the Most Accurate estimate of $1.63 and the Zacks Consensus Estimate of $1.62, is +0.62%. This is a meaningful and leading indicator of a likely positive surprise.
Zacks Rank: Boston Properties’ Zacks Rank #3, when combined with a positive ESP, makes us reasonably confident of a positive surprise this season.
What's Driving the Better-than-Expected Earnings?
Boston Properties’ assets are primarily concentrated in select high-rent, high barrier-to-entry geographic markets. The company’s solid tenant and industry base, including several bellwethers, ensure steady rental revenue growth. Over the past five years, it recorded annual revenue growth rate of 8.17%. This trend is likely to have continued in the second quarter as well.
Notably, the U.S. office vacancy rate remained steady at 13% in the second quarter amid a balanced demand-supply environment, per a study by the commercial real estate services’ firm – CBRE Group Inc. (NYSE:CBG). In around half of the U.S. office markets, vacancy recorded a decline and the national office vacancy rate is hovering close to its post-recession low.
In fact, with economic improvement and recovery in the job market, healthy growth in demand for office spaces is likely to have continued in the company’s markets in the quarter under review. Particularly, growth in demand for office space is anticipated to have been fueled by technology and life sciences businesses in the to-be-reported quarter.
The company projects second-quarter FFO per share in the range of $1.61–$1.63.
Amid these, reflecting analysts’ bullishness on the stock, the Zacks Consensus Estimate for second-quarter FFO per share inched up 0.6% to $1.62 over the last 30 days.
Stocks That Warrant a Look
Here are a few stocks in the REIT space that you may want to consider, as our model shows that these have the right combination of elements to report a positive surprise this time around:
CyrusOne Inc. (NASDAQ:CONE) , likely to release earnings on Aug 2, has an Earnings ESP of +2.70% and a Zacks Rank #2.
Piedmont Office Realty Trust, Inc. (NYSE:PDM) , expected to release earnings on Aug 2, has an Earnings ESP of +2.27% and a Zacks Rank #3. You can see the complete list of today’s Zacks #1 Rank stocks here.
AvalonBay Communities, Inc. (NYSE:AVB) , likely to release second-quarter numbers on Aug 2, has an Earnings ESP of +0.94% and a Zacks Rank #3.
Note: All EPS numbers presented in this write up represent funds from operations (“FFO”) per share. FFO, a widely used metric to gauge the performance of REITs, is obtained after adding depreciation and amortization and other non-cash expenses to net income.
The Hottest Tech Mega-Trend of All
Last year, it generated $8 billion in global revenues. By 2020, it's predicted to blast through the roof to $47 billion. Famed investor Mark Cuban says it will produce "the world's first trillionaires," but that should still leave plenty of money for regular investors who make the right trades early.
See Zacks' 3 Best Stocks to Play This Trend >>
AvalonBay Communities, Inc. (AVB): Free Stock Analysis Report
Boston Properties, Inc. (BXP): Free Stock Analysis Report
Piedmont Office Realty Trust, Inc. (PDM): Free Stock Analysis Report
CyrusOne Inc (CONE): Free Stock Analysis Report
Original post
Zacks Investment Research

