If the fiscal cliff is the biggest threat to the world economy as some experts say, it certainly isn’t showing up in the financial markets yet. Is the current rally in the foreign currencies and global equity markets a gigantic set-up coordinated by all the major money managers?
Overnight Tuesday, the dollar weakened on rising expectations that a deal will be reached to avoid the fiscal cliff. The boost in risk appetite sent the euro to a seven month high yesterday while pressuring the greenback because of its lack of appeal as a safe-haven currency.
The only pertinent news out of Europe may have underpinned the euro slightly. It’s been reported that Standard & Poor’s upgraded Greece’s rating to B-minus from SD, or selective default. The credit rating service cited last week’s successful buyback of distressed debt as the reason behind the move.

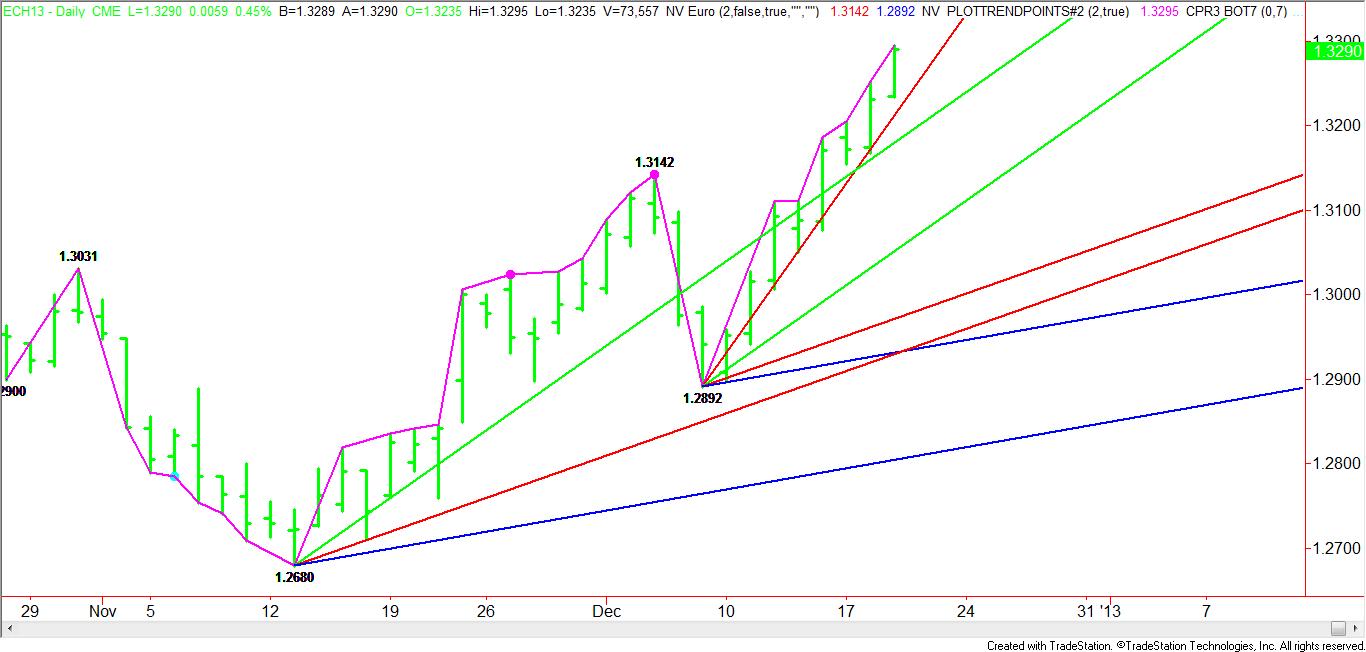
Technically, the March euro has accelerated to the upside since crossing the December 5 top at 1.3142. The market is currently trading on the bullish side of a Gann angle from the 1.2680 bottom at 1.3180. It is also following a steep uptrending Gann angle at 1.3212. A break through this angle will be the first sign of weakness.

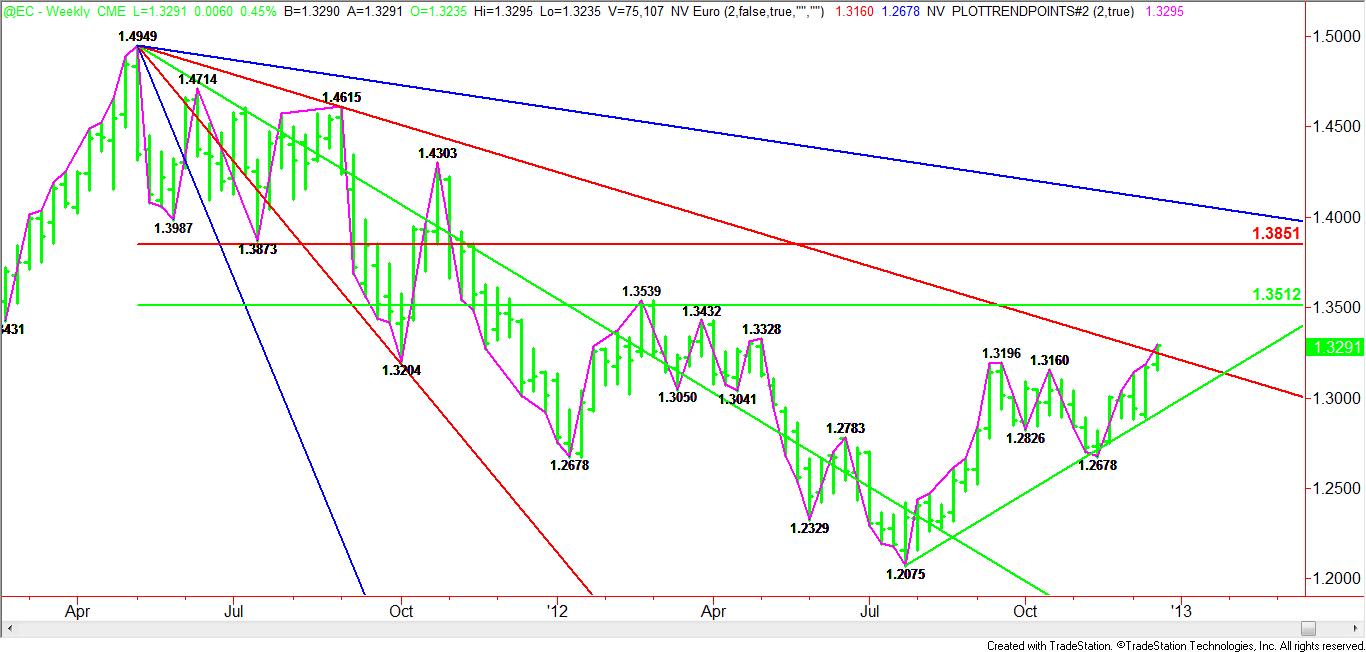
The weekly nearby euro chart is starting to show an emerging bullish picture. Overnight Tuesday, the market broke out over a downtrending Gann angle from the 1.4949 top from the week-ending May 6, 2011. This angle is at 1.3249. The nearest uptrending support angle is at 1.2915.
Based on the weekly range of 1.4949 to 1.2075, the retracement zone at 1.3512 to 1.3851 is the next potential upside target.
If positive news continues to come out of Washington regarding the fiscal cliff, then traders should look for the March euro to continue to grind higher. Several weeks ago, the euro rose from 1.2680 to 1.3142, or .0462 in 15 trading days. Based on the bottom at 1.2892 on December 7, a similar move will take the market to 1.3354 by December 31.
Traders trying to pick a top at this time are likely to continue to be frustrated until an intraday or daily closing price reversal top forms. This pattern typically leads to a 2 to 3 day break equal to at least 50% of the last rally. A closing price reversal will be the strongest sign that a top has been reached at least temporarily.
Overnight Tuesday, the dollar weakened on rising expectations that a deal will be reached to avoid the fiscal cliff. The boost in risk appetite sent the euro to a seven month high yesterday while pressuring the greenback because of its lack of appeal as a safe-haven currency.
The only pertinent news out of Europe may have underpinned the euro slightly. It’s been reported that Standard & Poor’s upgraded Greece’s rating to B-minus from SD, or selective default. The credit rating service cited last week’s successful buyback of distressed debt as the reason behind the move.

Technically, the March euro has accelerated to the upside since crossing the December 5 top at 1.3142. The market is currently trading on the bullish side of a Gann angle from the 1.2680 bottom at 1.3180. It is also following a steep uptrending Gann angle at 1.3212. A break through this angle will be the first sign of weakness.

The weekly nearby euro chart is starting to show an emerging bullish picture. Overnight Tuesday, the market broke out over a downtrending Gann angle from the 1.4949 top from the week-ending May 6, 2011. This angle is at 1.3249. The nearest uptrending support angle is at 1.2915.
Based on the weekly range of 1.4949 to 1.2075, the retracement zone at 1.3512 to 1.3851 is the next potential upside target.
If positive news continues to come out of Washington regarding the fiscal cliff, then traders should look for the March euro to continue to grind higher. Several weeks ago, the euro rose from 1.2680 to 1.3142, or .0462 in 15 trading days. Based on the bottom at 1.2892 on December 7, a similar move will take the market to 1.3354 by December 31.
Traders trying to pick a top at this time are likely to continue to be frustrated until an intraday or daily closing price reversal top forms. This pattern typically leads to a 2 to 3 day break equal to at least 50% of the last rally. A closing price reversal will be the strongest sign that a top has been reached at least temporarily.
