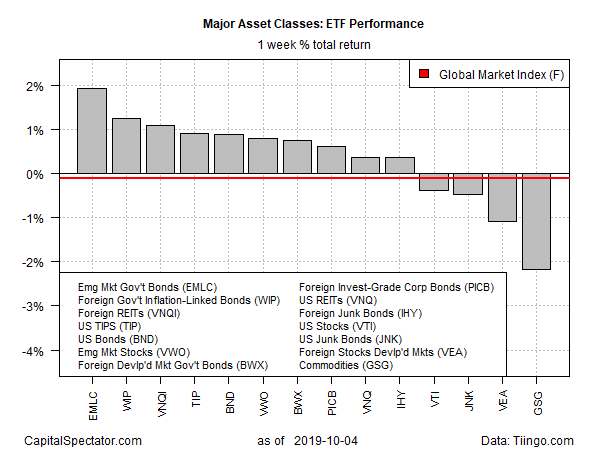
After meandering for a month, emerging-market bonds came alive in October’s first week of trading. This slice of global fixed-income securities posted the strongest increase last week for the major asset classes, based on a set of exchange traded funds.
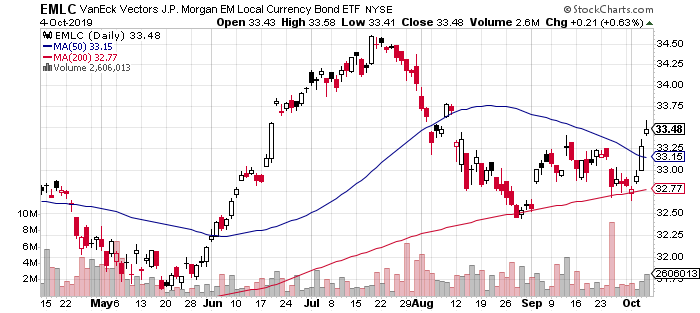
VanEck Vectors JP Morgan Emerging Market Local Currency Bond (NYSE:EMLC) surged 1.9% for the trading week ended Friday, Oct. 4. The gain, which lifted the ETF at one point last week to its highest close since August, marks the strongest weekly advance in nearly three months.

Expectations that global interest rates will continue to drift lower is a factor in EMLC’s latest rise. As the search for yield intensifies at a time of unusually low rates around the world, the relatively high payout for government bonds in emerging markets is attracting more attention. EMLC’s trailing 12-month yield, according to Morningstar.com, is 6.4%. By contrast, the U.S. investment-grade benchmark – via Vanguard Total Bond Market (NYSE:BND) – posted a trailing one-year yield of just 2.7%.
Last week’s biggest loss for the major asset classes: broadly defined commodities. The iShares S&P GSCI Commodity-Indexed Trust (NYSE:GSG) fell for a second week, slumping 2.2%, which left the fund close to a one-month low.

Modest losses in U.S. and foreign developed-market equities last week weighed on an ETF-based version of the Global Market Index (GMI.F). This unmanaged benchmark, which holds all the major asset classes (except cash) in market-value weights, fell by a slightly 0.1% last week – its third straight weekly setback.
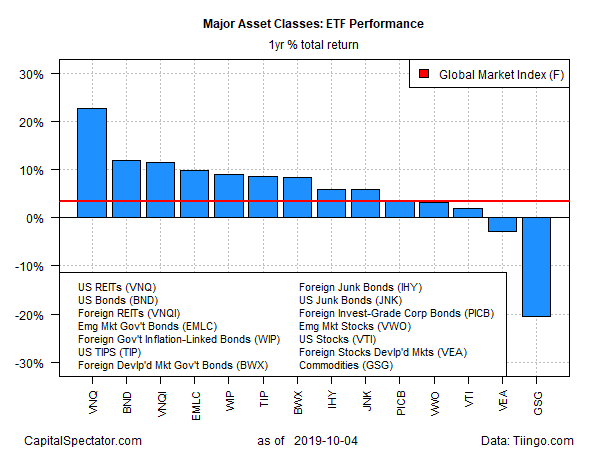
For the one-year trend, U.S. real estate investment trusts continue to lead by a wide margin. Vanguard Real Estate (NYSE:VNQ) is up 22.8% on a total return basis for the past year. That’s nearly twice the gain over the second-best performer for the major asset classes: investment-grade U.S. bonds, based on Vanguard Total Bond Market (BND), which is ahead by 11.9% on a total return basis for the trailing 12-month period.
Meanwhile, commodities continue to post the deepest loss for one-year results. GSG is off 20.5% as of Friday’s close vs. the year-earlier level.
GMI.F is still holding on to a modest 3.4% gain for the one-year trailing period.

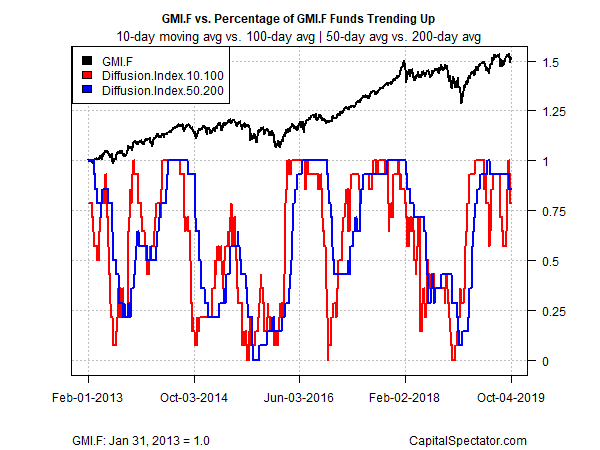
Profiling the major asset classes through a momentum lens shows that some cracks are forming after a near-perfect run of upside bias recently. The analysis is based on two sets of moving averages for the ETFs listed above. The first compares the 10-day moving average with its 100-day counterpart — a proxy for short-term trending behavior (red line in chart below). A second set of moving averages (50 and 200 days) represent an intermediate measure of the trend (blue line). Notably, the intermediate trend for the funds has slipped to the lowest reading since April. The 0.86 print is still elevated, but the latest downtick suggests that the extraordinary run of strength in nearly all the major asset classes is showing signs of age.

