The FOMC raised the Fed Funds rate last week. Inflation has picked up a bit. The Bond Kings have proclaimed a new bear market in bonds. Yet the prices of US Treasuries refuse to play along. They continue to hold onto the edge of support and defy gravity. How long can their grip hold out before they lose the strength and let go?
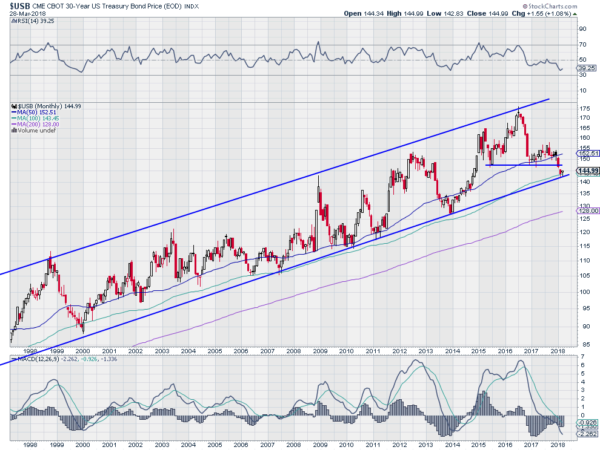
The chart below shows the price of US Treasury Bonds over the last 20 years. It looks the same if you add another 10 years to it. The rising channel has been in place that entire time. Lower support has been tested many times and held over this period. And as March finishes it is being tested again. Back to back months printing a small body candle at support and just over the 100 month SMA. Barring a large move it will be an inside candle for the month of March.
There are signs that the situation is getting weaker. The most notable is the MACD continuing lower and now posting the lowest level in this momentum gauge in over 20 years. And then there are signs that prices might bounce again like thy have every other time. The other momentum indicator, the RSI, is turning back higher, after just breaking below the edge of the bullish zone.
A mixed picture. And that seems to be reflected in sentiment as well, with the bond kings on one side calling for a correction while the floor boss Art Cashin is thinking the highs (in yield, so low in prices) for the year may be in. This is why waiting for confirmation is so important…. and hard to do. We still do not have an answer as to whether the Bond bull market is over. Go back to sitting on your hands.
The information in this blog post represents my own opinions and does not contain a recommendation for any particular security or investment. I or my affiliates may hold positions or other interests in securities mentioned in the Blog, please see my Disclaimer page for my full disclaimer.

