April has come to a close and there are fresh monthly charts to review. The markets have had a roller coaster ride during the first 4 months of 2018. This has resulted in the cadre of pundits getting more forceful about their views on the markets. One market, the Bond Market, has attracted a lot of attention. Bond Kings have called the top. The FOMC has ramped up the debate for a possible 4th rate hike this year. And the yield on the 10 year Treasury Note has peeked over 3%. All of this has loaded the boat on the short Bond trade. But is it time yet?
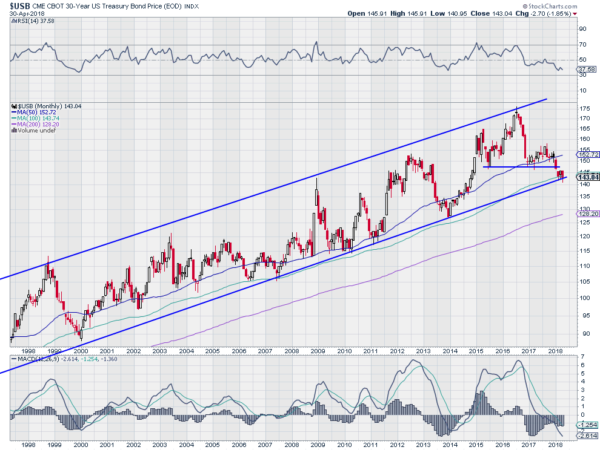
The monthly chart below tells the story from a technician’s perspective. There are 21 years of price action in that chart. If you went back another 10 years you would see more of the same. A long rising channel of prices. And zooming in on the most recent timeframe shows the price has pierced the bottom of the channel. But it rebounded to close above it. Down, but not out yet.
So as Bonds head into May what is there to look for? You can see form the chart that a touch at the bottom of the channel and the 100 month SMA has resulted in a reversal higher many times before. Reversals have also occurred when the RSI has fallen under 40 and the MACD has reached extreme lows, like it is now. But these factors also define a bear market. Price is the ultimate arbiter, so we need to continue to watch it for the final answer.
A break and close below the channel in May would signal a bearish reversal for some. A close below the low at the end of 2013 would draw in more bears. But until these occur Bonds are down but not out. They remain in the long term uptrend.
The information in this blog post represents my own opinions and does not contain a recommendation for any particular security or investment. I or my affiliates may hold positions or other interests in securities mentioned in the Blog, please see my Disclaimer page for my full disclaimer

