Despite the popular meme, interest rates are actually going up in this rising rate environment. They have been since January. If you would like to debate how long it will last or how far they will go that is fine. But the yield on US 30 year Treasuries have risen over 85 bps since the bottom at the end of January. And for all you fear mongers that have been discussing the German Bund tripling (from like 5 bps to 15 bps) that is a nearly 40% rise in interest rates. Put in context, rates are just over 3.10% from a low near 2.20%. They are still pretty low. But from my math days, 3.10% is higher than 2.20%, so rates are going up.
Now that we have established that the logical next point of discussion is how high will they go. I can not answer that with certainty, but I can analyse the price action for clues and recognize some important points that may be useful as the yield moves. As an equity trader and investor I look to the 20 year US Treasury ETF ARCA:TLT for my analysis.

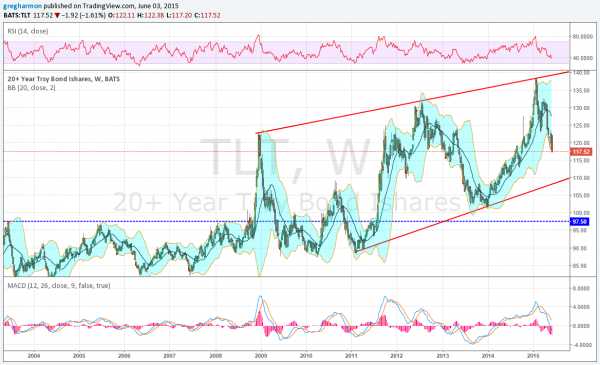
Above is the weekly chart of the Bond ETF since 2003. There are just a few important things to focus on. First, prior to the US financial crisis in 2008, Treasuries were moving sideways in a tight range for 6 years. The crisis was a catalyst for rates to fall as monetary policy became accommodative and fear drove investors to Treasuries.
From that point there was a change of character in Treasuries in 2 ways. First they shifted to a rising channel as rates were falling. And second the range became wider. Generally lower yields but also higher volatility. The wide swings created a rising trend resistance line and it touched that at the low yield at the end of January.
Each of the prior two touches moved lower, with yields increasing, over the next 18 to 24 months. For contrast the current move lower in prices has lasted only 5 months so far. Also each of the prior moves lower built a rising trend support line. You can see from the chart that the current price is still far above that line. This is one placer to focus on for a pause in the fall in prices.
Measured a different way, each pullback has been between $30 and $35 while the current pullback has managed only $20 so far. The prior pullbacks were 29% and 23% of the price and covered 100% and 68% of the moves higher. This one is only 15% lower and has retraced 55% of the leg up. By prior standards the fall in prices has more room to go. If the price did fall to the rising trend support it would be a $29 move lower, or 21% retracing 80% of the leg higher. Much more in line with previous moves.
The second place to look at is the long term price level of resistance before the change of character at 97.50. If the change in posture of the Federal Reserve does materialize and they do tighten rates this could certainly yield another change in character for Bond prices. Because this level was important for 6 years it could certainly show its importance again. If it does then hindsight bond market watchers will no doubt proclaim that the whole rising wedge from 2008 to 2015 and then retreat was just a shift to accomodative policy and then away from it. Naturally the data will prove them correct.
I started by saying I can not tell you where the fall in prices and rise in yields will stop. No one can. But price has history and memory. Watch for these price levels to help with your own risk management in the Bond sector.
DISCLAIMER: The information in this blog post represents my own opinions and does not contain a recommendation for any particular security or investment. I or my affiliates may hold positions or other interests in securities mentioned in the Blog, please see my Disclaimer page for my full disclaimer.
