Investing.com’s stocks of the week
I began trading in 1987. At the time, I noticed that the bond market was falling. I was confused because the stock market was rallying while the bond market was creating a great, low risk alternative in the form of CDs. Eventually, traders saw that the high risk stock market was too dangerous, and the market repriced down 25% in one day in October, 1987.

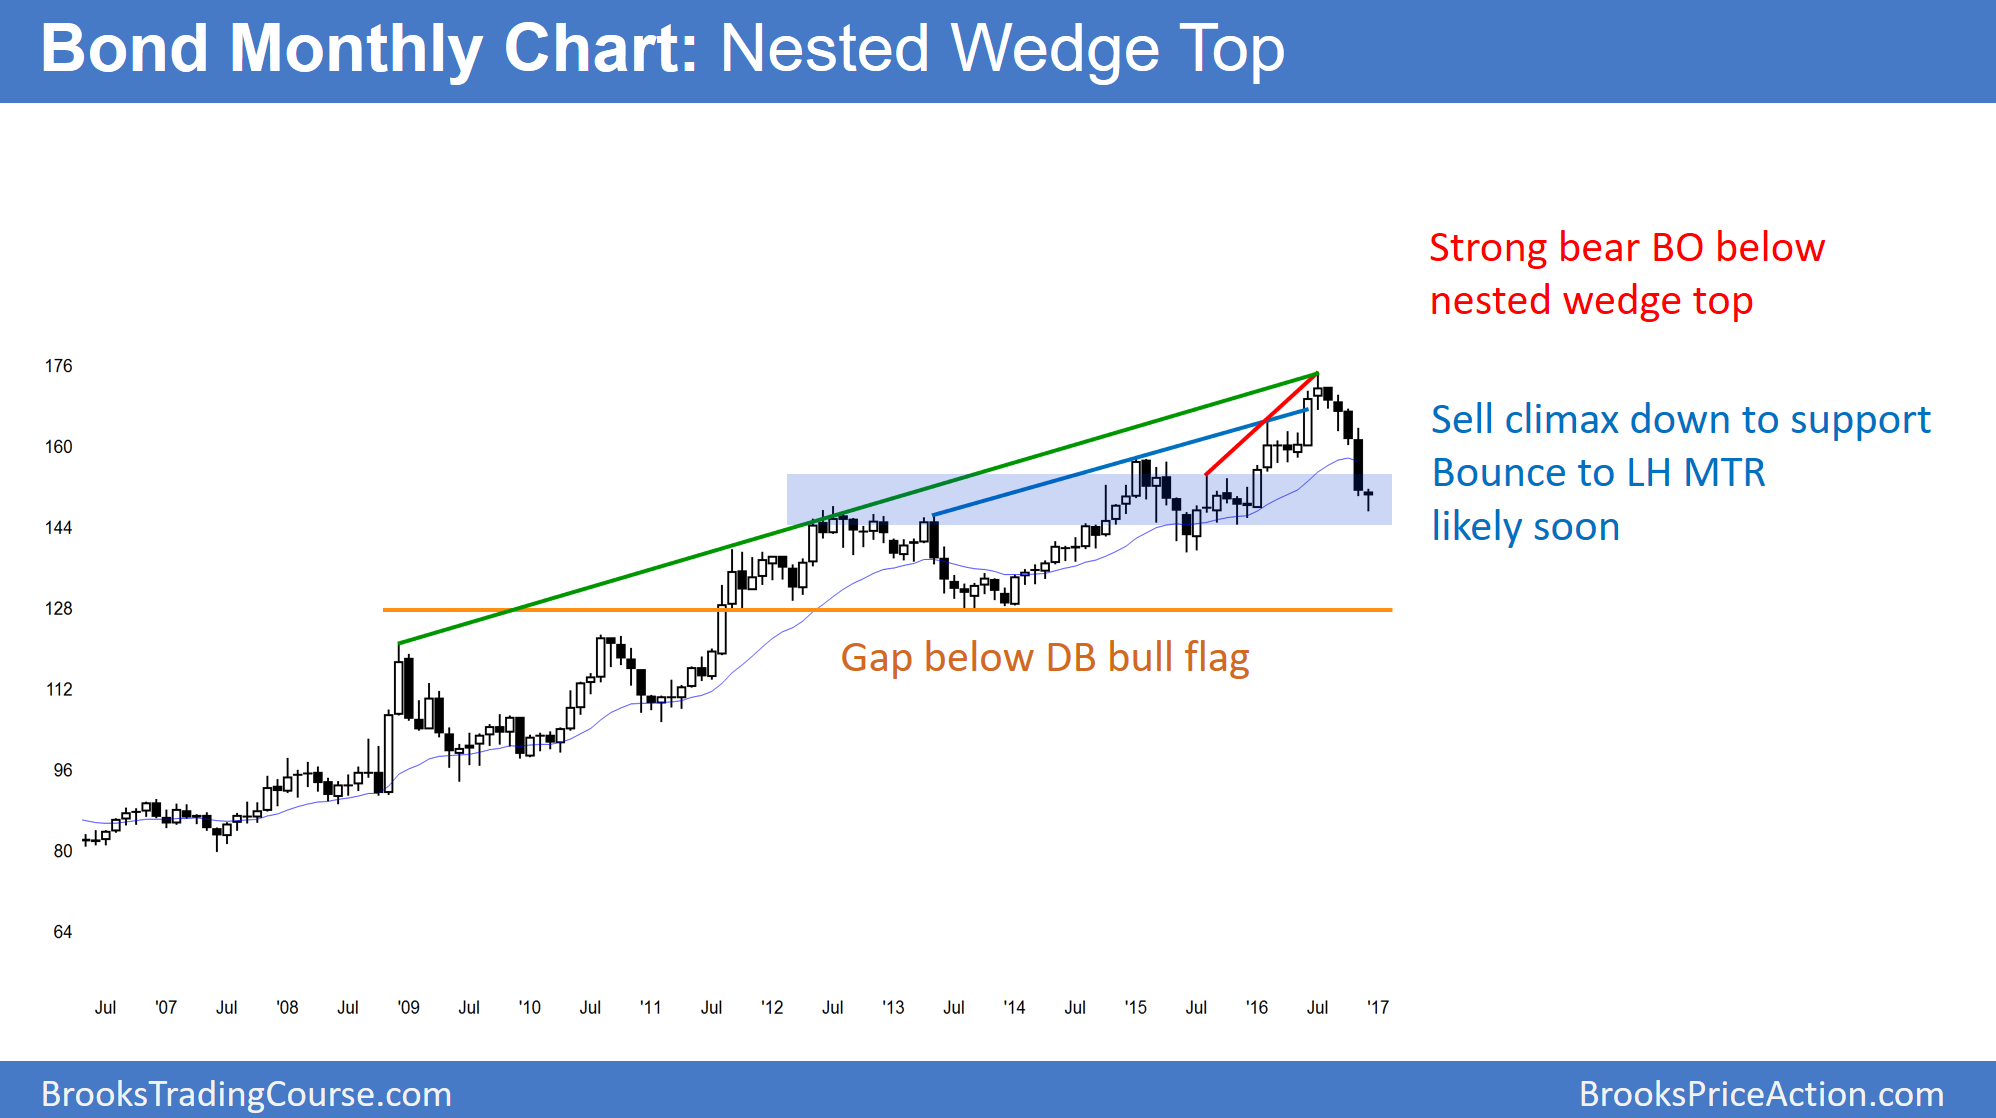
The monthly chart of the 30-Year bond market had a strong bear breakout after nested wedge tops. While the sell climax will probably lead to a rally over the next couple of months, the odds favor a lower high major trend reversal and a bear trend.
The bond market has rallied strongly for the past 30 years. Yet, its monthly chart has nested wedge tops. In addition, there has been a big bear breakout. Wedge tops that reverse down strongly typically have at least one more leg down. How far down will it go? Every prior higher low in the bull trend is a target. Especially relevant is the gap below the August 2013 low. In addition, that low formed a double bottom bull flag with the March 2012 low, around 125. That is therefore an obvious magnet over the next few years.
Like 1987, higher interest rates on CDs provide a low risk alternative to stocks. As a result, money will probably begin to shift from stocks to CDs. Hence, the stock market will probably reprice down as interest rates rise.
While the bond selloff has been climactic and a significant bounce is likely, the odds favor a top. Hence, the rally will probably form a lower high major trend reversal on the monthly chart.
